Please do the bonus problem using Matlab
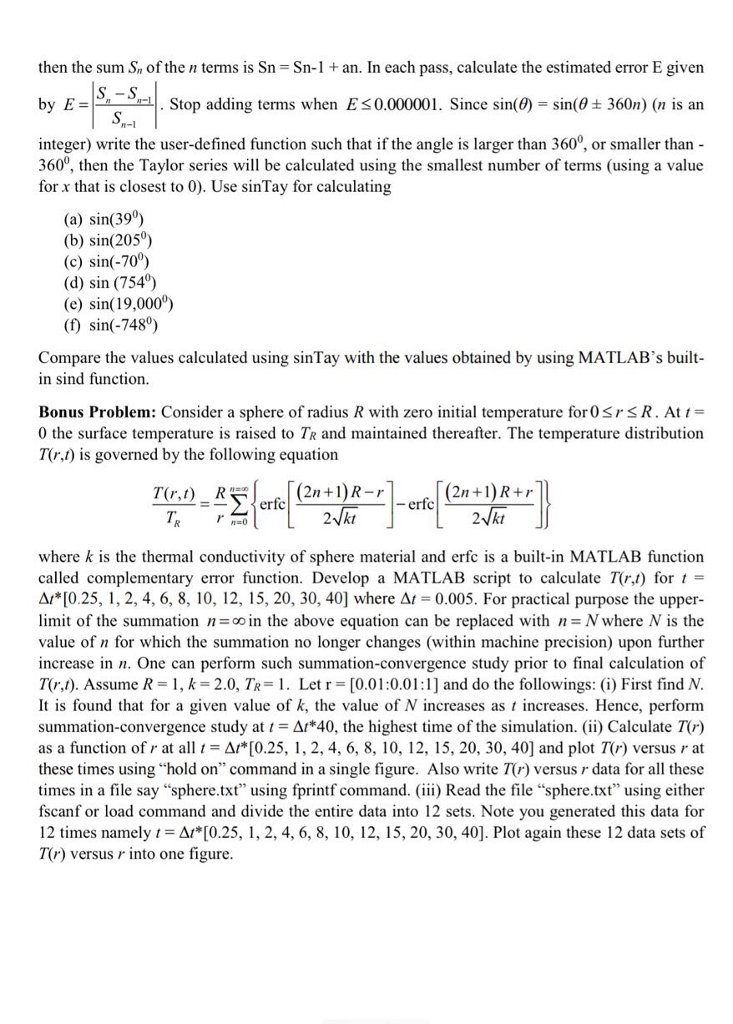
then the sum Sn of the n terms is Sn = Sn-1 + an. In each pass, calculate the estimated error E given S-S by E-or Yr11. Stop adding terms when E 0.000001. Since sin() = sin(e+ 360n) (n is an integer) write the user-defined function such that if the angle is larger than 360, or smaller than 360, then the Taylor series will be calculated using the smallest number of terms (using a value for x that is closest to 0). Use sinTay for calculating (a) sin(390) (b) sin(2050) (c) sin(-70) (d) sin (7540) (e) sin(19,000) (f) sin(-748) Compare the values calculated using sinTay with the values obtained by using MATLAB's built- in sind function. Bonus Problem: Consider a sphere of radius R with zero initial temperature for0 srR. Att 0 the surface temperature is raised to TR and maintained thereafter. The temperature distribution T(r,t) is governed by the following equation 2n+1)R-r (2n+1) R+1 erfc where k is the thermal conductivity of sphere material and erfc is a built-in MATLAB function called complementary error function. Develop a MATLAB script to calculate Trd) for t = 0.25, 1, 2, 4, 6, 8, 10, 12, 15, 20, 30, 40] where 1-0.005. For practical purpose the upper- limit of the summation n=oo in the above equation can be replaced with n=N where N is the value of n for which the summation no longer changes (within machine precision) upon further increase in n. One can perform such summation-convergence study prior to final calculation of Trd). Assume R = 1, k = 2.0, TR-1. Let r = [0.01:0.01 :1] and do the followings: (i) First find N It is found that for a given value of k, the value of N increases as increases. Hence, perform summation-convergence study at t = -40, the highest time of the simulation. (ii) Calculate Tr) as a function of r at all 1 = 1*[0.25, 1, 2, 4, 6, 8, 10, 12, 15, 20, 30, 401 and plot T(r) versus r at these times using "hold on" command in a single figure. Also write TV-) versus r data for all these times in a file say "sphere.txt" using fprintf command. (iii) Read the file "sphere.txt" using either fscanf or load command and divide the entire data into 12 sets. Note you generated this data for 12 times namely 1 = 0.25, 1, 2, 4, 6, 8, 10, 12, 15, 20, 30, 401. Plot again these 12 data sets of T(r) versus r into one figure then the sum Sn of the n terms is Sn = Sn-1 + an. In each pass, calculate the estimated error E given S-S by E-or Yr11. Stop adding terms when E 0.000001. Since sin() = sin(e+ 360n) (n is an integer) write the user-defined function such that if the angle is larger than 360, or smaller than 360, then the Taylor series will be calculated using the smallest number of terms (using a value for x that is closest to 0). Use sinTay for calculating (a) sin(390) (b) sin(2050) (c) sin(-70) (d) sin (7540) (e) sin(19,000) (f) sin(-748) Compare the values calculated using sinTay with the values obtained by using MATLAB's built- in sind function. Bonus Problem: Consider a sphere of radius R with zero initial temperature for0 srR. Att 0 the surface temperature is raised to TR and maintained thereafter. The temperature distribution T(r,t) is governed by the following equation 2n+1)R-r (2n+1) R+1 erfc where k is the thermal conductivity of sphere material and erfc is a built-in MATLAB function called complementary error function. Develop a MATLAB script to calculate Trd) for t = 0.25, 1, 2, 4, 6, 8, 10, 12, 15, 20, 30, 40] where 1-0.005. For practical purpose the upper- limit of the summation n=oo in the above equation can be replaced with n=N where N is the value of n for which the summation no longer changes (within machine precision) upon further increase in n. One can perform such summation-convergence study prior to final calculation of Trd). Assume R = 1, k = 2.0, TR-1. Let r = [0.01:0.01 :1] and do the followings: (i) First find N It is found that for a given value of k, the value of N increases as increases. Hence, perform summation-convergence study at t = -40, the highest time of the simulation. (ii) Calculate Tr) as a function of r at all 1 = 1*[0.25, 1, 2, 4, 6, 8, 10, 12, 15, 20, 30, 401 and plot T(r) versus r at these times using "hold on" command in a single figure. Also write TV-) versus r data for all these times in a file say "sphere.txt" using fprintf command. (iii) Read the file "sphere.txt" using either fscanf or load command and divide the entire data into 12 sets. Note you generated this data for 12 times namely 1 = 0.25, 1, 2, 4, 6, 8, 10, 12, 15, 20, 30, 401. Plot again these 12 data sets of T(r) versus r into one figure