Please don't copy and paste the answer from another question that is kind of similar to this since I think they are different. There are some additional numbers at the end compare to the other question. thank you.
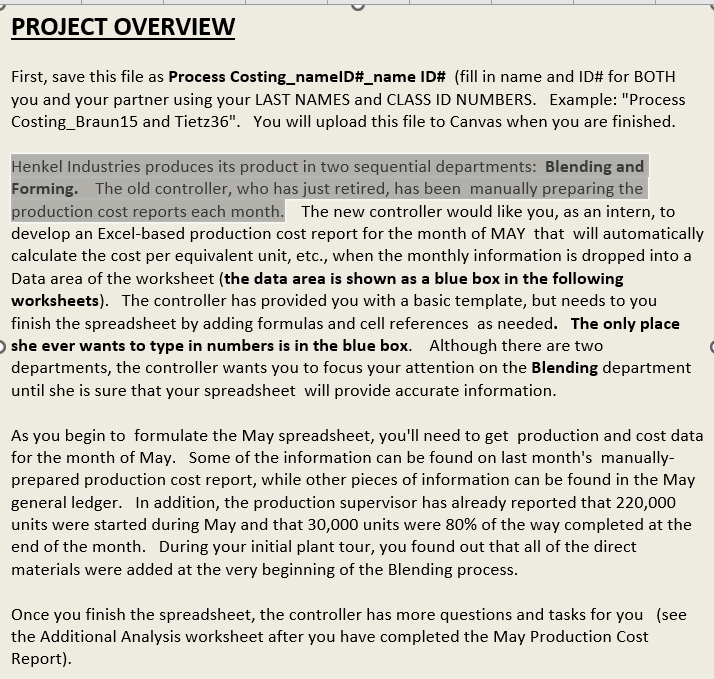
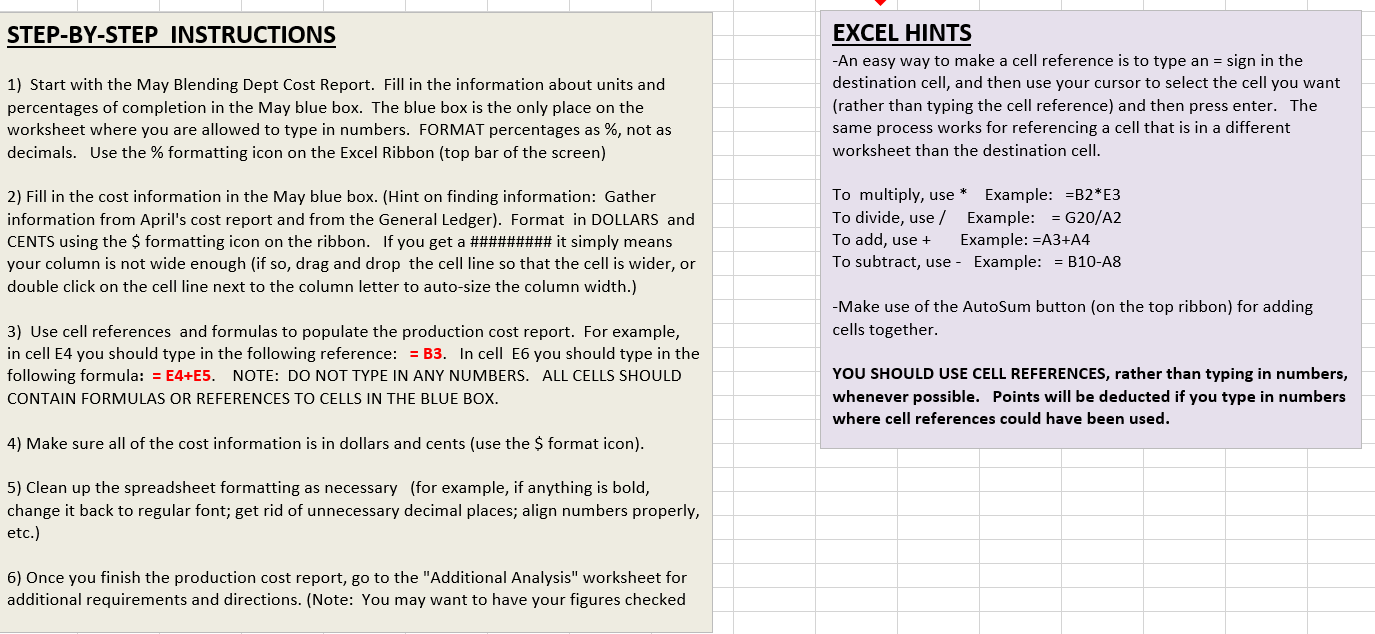
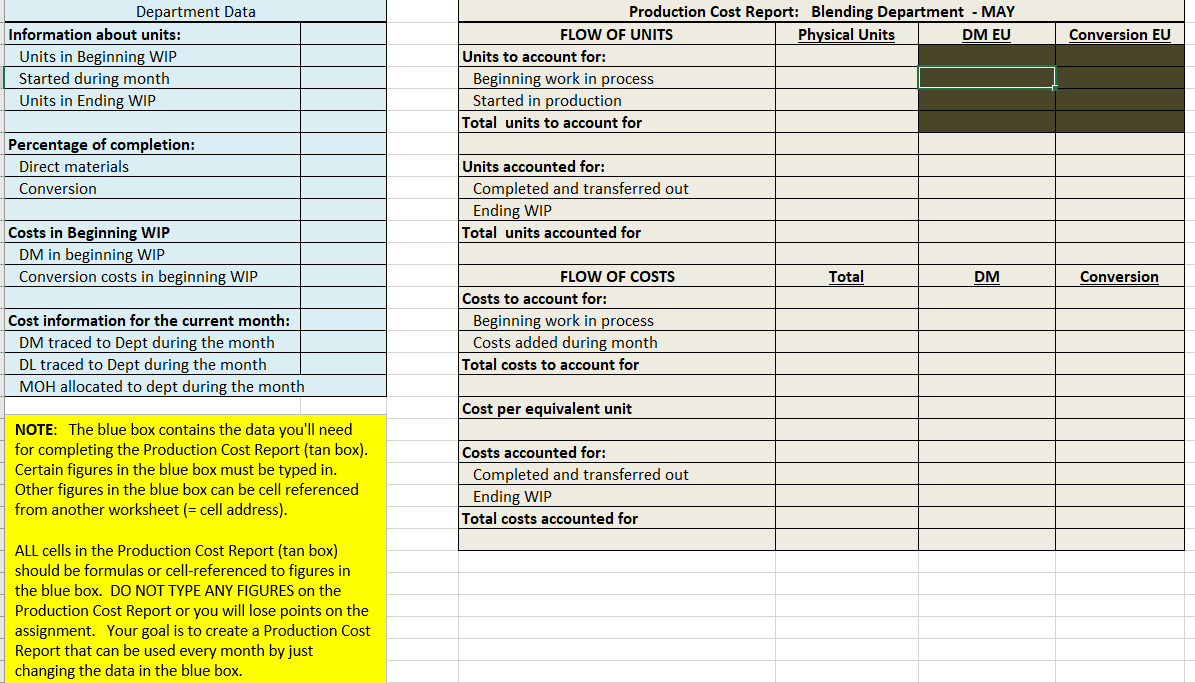
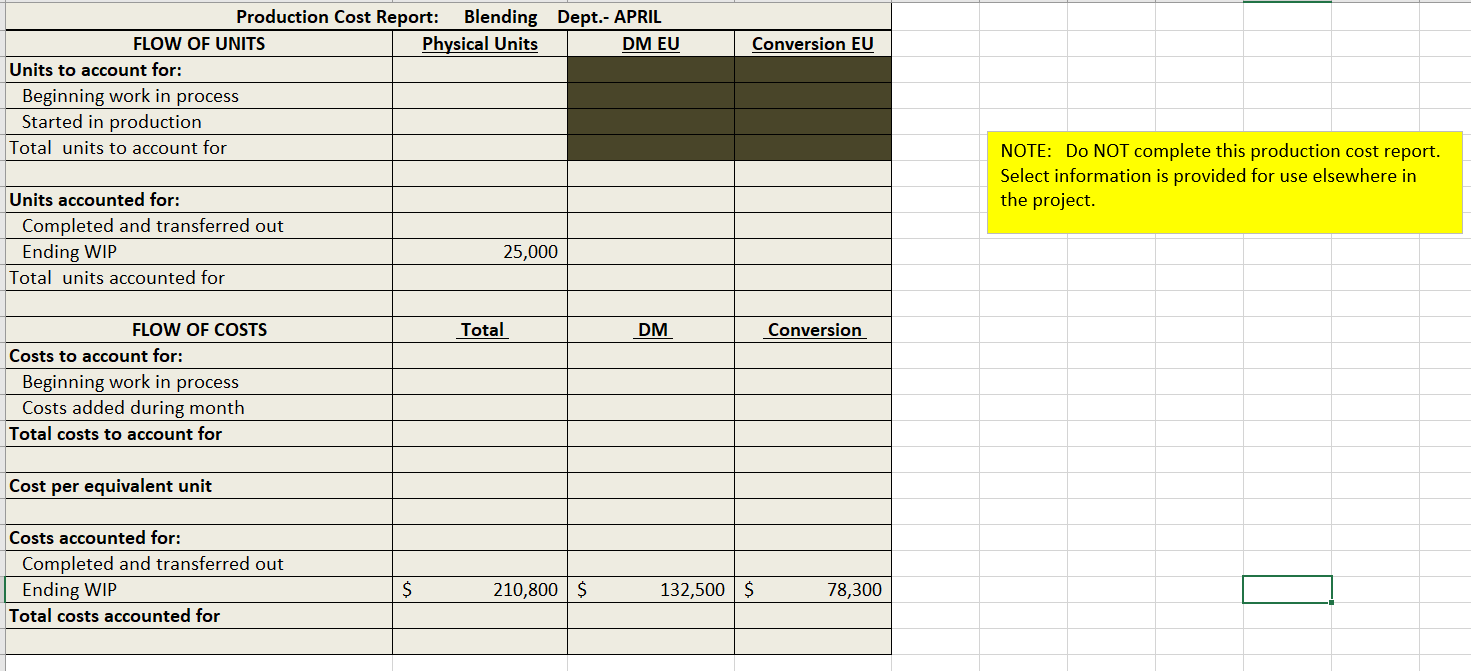
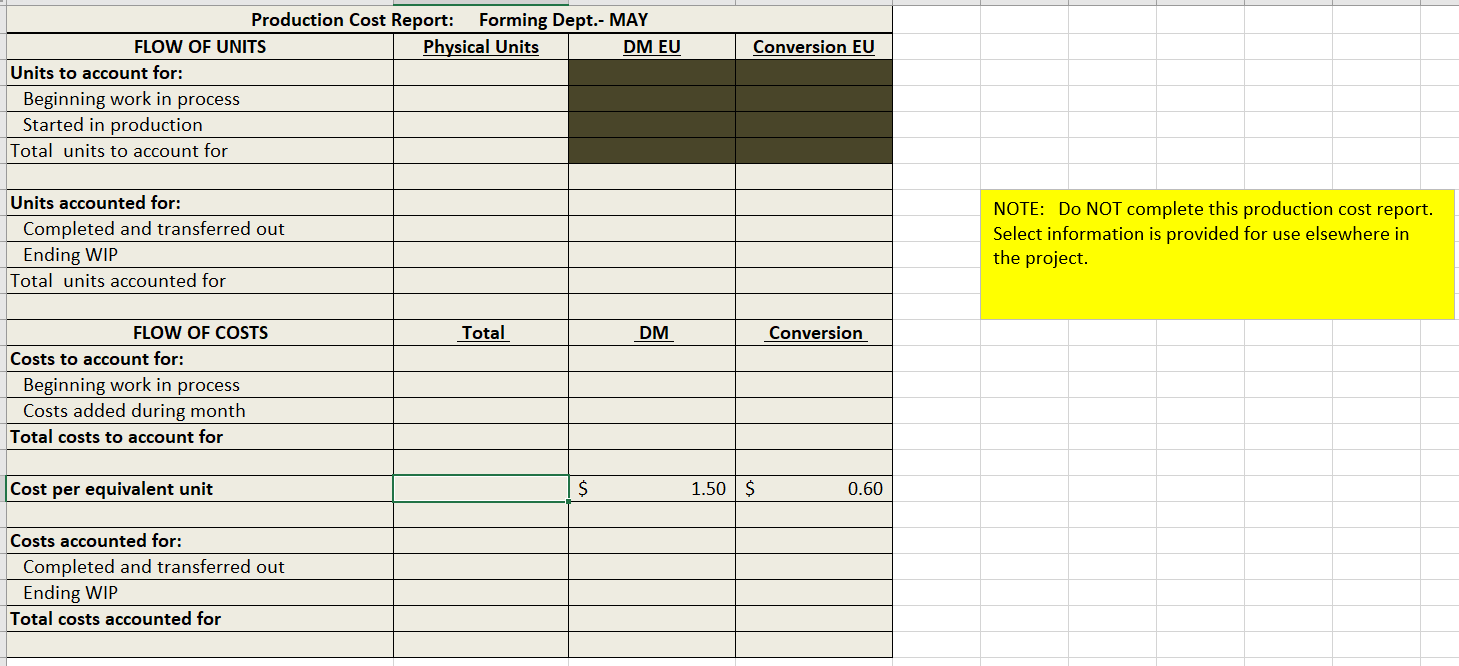
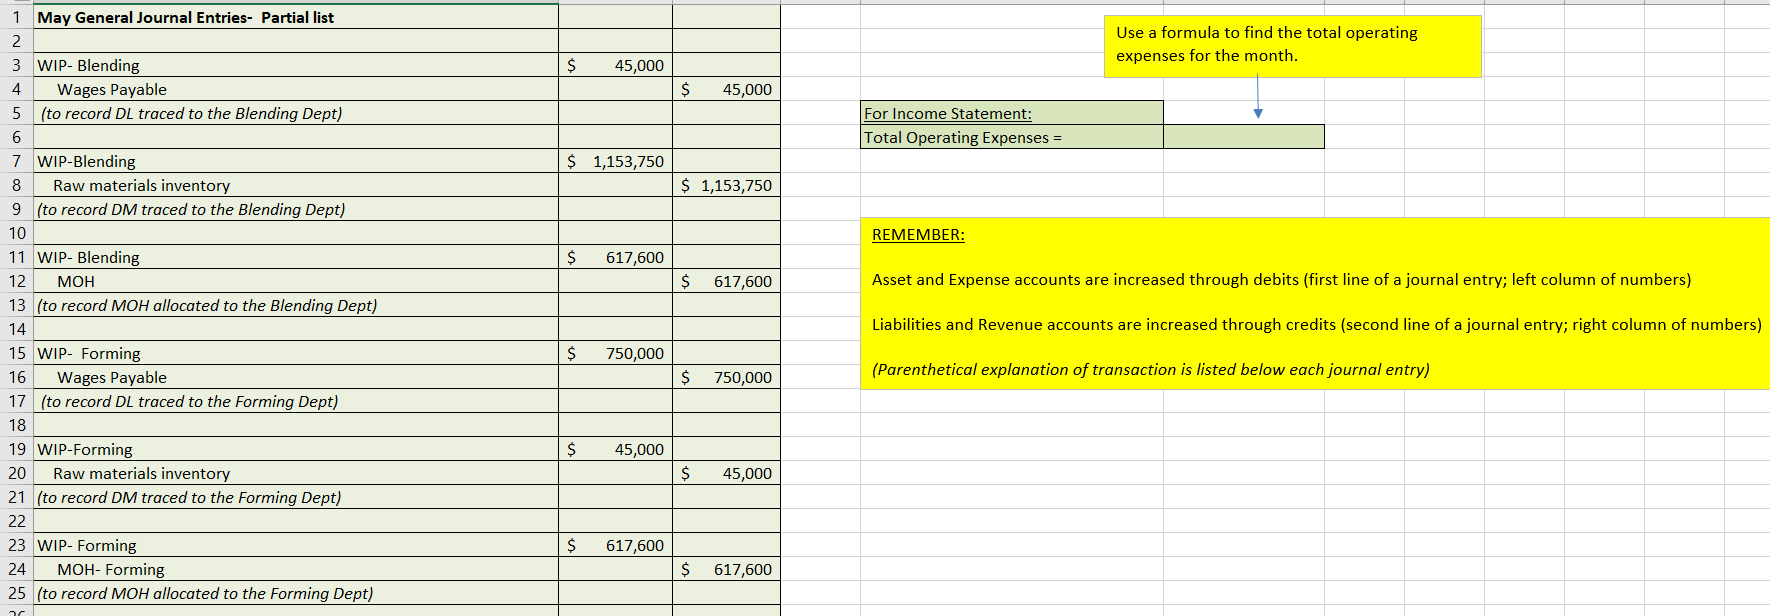
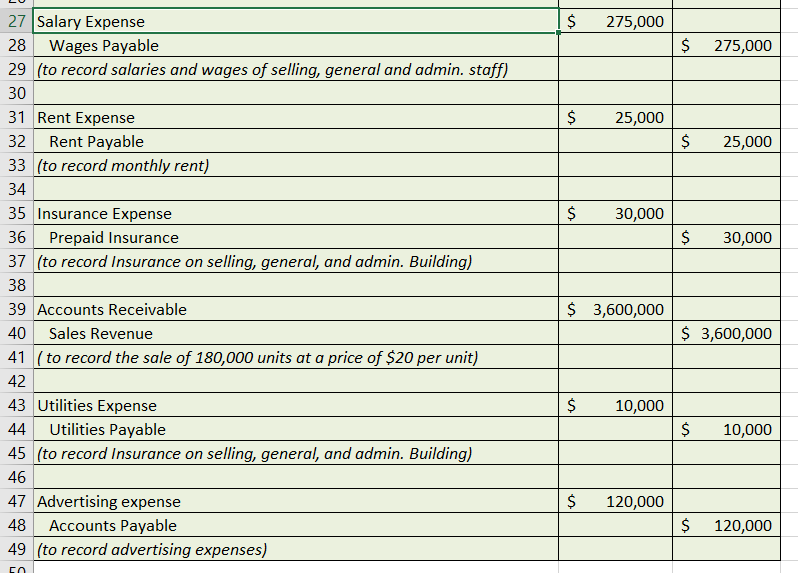
First, save this file as Process Costing_namelD#_name ID# (fill in name and ID# for BOTH you and your partner using your LAST NAMES and CLASS ID NUMBERS. Example: "Process Costing_Braun15 and Tietz36". You will upload this file to Canvas when you are finished. Henkel Industries produces its product in two sequential departments: Blending and Forming. The old controller, who has just retired, has been manually preparing the production cost reports each month. The new controller would like you, as an intern, to develop an Excel-based production cost report for the month of MAY that will automatically calculate the cost per equivalent unit, etc., when the monthly information is dropped into a Data area of the worksheet (the data area is shown as a blue box in the following worksheets). The controller has provided you with a basic template, but needs to you finish the spreadsheet by adding formulas and cell references as needed. The only place she ever wants to type in numbers is in the blue box. Although there are two departments, the controller wants you to focus your attention on the Blending department until she is sure that your spreadsheet will provide accurate information. As you begin to formulate the May spreadsheet, you'll need to get production and cost data for the month of May. Some of the information can be found on last month's manuallyprepared production cost report, while other pieces of information can be found in the May general ledger. In addition, the production supervisor has already reported that 220,000 units were started during May and that 30,000 units were 80% of the way completed at the end of the month. During your initial plant tour, you found out that all of the direct materials were added at the very beginning of the Blending process. Once you finish the spreadsheet, the controller has more questions and tasks for you (see the Additional Analysis worksheet after you have completed the May Production Cost Report). STEP-BY-STEP INSTRUCTIONS EXCEL HINTS 5) Clean up the spreadsheet formatting as necessary (for example, if anything is bold, change it back to regular font; get rid of unnecessary decimal places; align numbers properly, etc.) 6) Once you finish the production cost report, go to the "Additional Analysis" worksheet for additional requirements and directions. (Note: You may want to have your figures checked should be formulas or cell-referenced to figures in the blue box. DO NOT TYPE ANY FIGURES on the Production Cost Report or you will lose points on the assignment. Your goal is to create a Production Cost Report that can be used every month by just changing the data in the blue box. NOTE: Do NOT complete this production cost report. Select information is provided for use elsewhere in the project. NOTE: Do NOT complete this production cost report. Select information is provided for use elsewhere in the project. First, save this file as Process Costing_namelD#_name ID# (fill in name and ID# for BOTH you and your partner using your LAST NAMES and CLASS ID NUMBERS. Example: "Process Costing_Braun15 and Tietz36". You will upload this file to Canvas when you are finished. Henkel Industries produces its product in two sequential departments: Blending and Forming. The old controller, who has just retired, has been manually preparing the production cost reports each month. The new controller would like you, as an intern, to develop an Excel-based production cost report for the month of MAY that will automatically calculate the cost per equivalent unit, etc., when the monthly information is dropped into a Data area of the worksheet (the data area is shown as a blue box in the following worksheets). The controller has provided you with a basic template, but needs to you finish the spreadsheet by adding formulas and cell references as needed. The only place she ever wants to type in numbers is in the blue box. Although there are two departments, the controller wants you to focus your attention on the Blending department until she is sure that your spreadsheet will provide accurate information. As you begin to formulate the May spreadsheet, you'll need to get production and cost data for the month of May. Some of the information can be found on last month's manuallyprepared production cost report, while other pieces of information can be found in the May general ledger. In addition, the production supervisor has already reported that 220,000 units were started during May and that 30,000 units were 80% of the way completed at the end of the month. During your initial plant tour, you found out that all of the direct materials were added at the very beginning of the Blending process. Once you finish the spreadsheet, the controller has more questions and tasks for you (see the Additional Analysis worksheet after you have completed the May Production Cost Report). STEP-BY-STEP INSTRUCTIONS EXCEL HINTS 5) Clean up the spreadsheet formatting as necessary (for example, if anything is bold, change it back to regular font; get rid of unnecessary decimal places; align numbers properly, etc.) 6) Once you finish the production cost report, go to the "Additional Analysis" worksheet for additional requirements and directions. (Note: You may want to have your figures checked should be formulas or cell-referenced to figures in the blue box. DO NOT TYPE ANY FIGURES on the Production Cost Report or you will lose points on the assignment. Your goal is to create a Production Cost Report that can be used every month by just changing the data in the blue box. NOTE: Do NOT complete this production cost report. Select information is provided for use elsewhere in the project. NOTE: Do NOT complete this production cost report. Select information is provided for use elsewhere in the project


