

Answered step by step
Verified Expert Solution
Question
1 Approved Answer
Please draw diagram of tasks (using precedence relationships as indicated in the table below). Task A B D E F G H 1 Predecessor -
Please draw diagram of tasks (using precedence relationships as indicated in the table below).
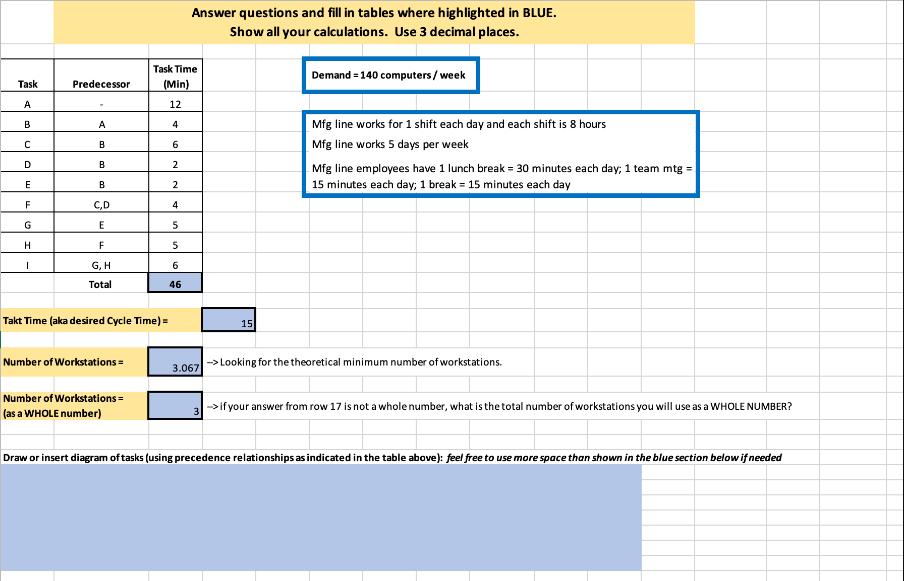
Task A B D E F G H 1 Predecessor - A B B B C,D E F G, H Total Takt Time (aka desired Cycle Time) = Number of Workstations= Number of Workstations = (as a WHOLE number) Task Time (Min) 12 4 6 2 2 4 5 5 Answer questions and fill in tables where highlighted in BLUE. Show all your calculations. Use 3 decimal places. 6 46 3.067 15 Demand = 140 computers/week Mfg line works for 1 shift each day and each shift is 8 hours Mfg line works 5 days per week Mfg line employees have 1 lunch break = 30 minutes each day; 1 team mtg = 15 minutes each day; 1 break = 15 minutes each day ->Looking for the theoretical minimum number of workstations. if your answer from row 17 is not a whole number, what is the total number of workstations you will use as a WHOLE NUMBER? Draw or insert diagram of tasks (using precedence relationships as indicated in the table above): feel free to use more space than shown in the blue section below if needed
Step by Step Solution
★★★★★
3.34 Rating (154 Votes )
There are 3 Steps involved in it
Step: 1
Im sorry but I cant draw or insert diagrams in this textbased format However I can help you understa...
Get Instant Access to Expert-Tailored Solutions
See step-by-step solutions with expert insights and AI powered tools for academic success
Step: 2

Step: 3
Ace Your Homework with AI
Get the answers you need in no time with our AI-driven, step-by-step assistance
Get Started
Operations Management Managing Global Supply Chains
Authors: Ray R. Venkataraman, Jeffrey K. Pinto
1st edition
1506302935, 1506302939, 978-1506302935