

Question
Please estimate required rates of return (WACC) for the cash flows originating in Argentina, Brazil, and Chile from a local perspective and from a US
Please estimate required rates of return (WACC) for the cash flows originating in Argentina, Brazil, and Chile from a local perspective and from a US $ perspective.
Please estimate required rates of return (WACC) for the cash flows originating in Argentina, Brazil, and Chile from a local perspective and from a US $ perspective.
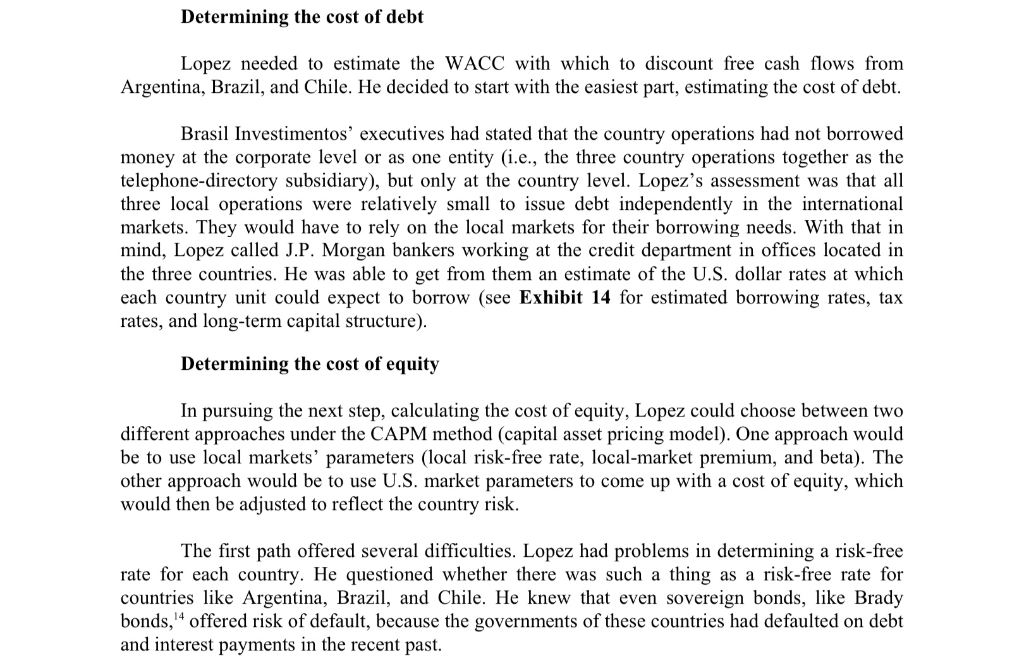
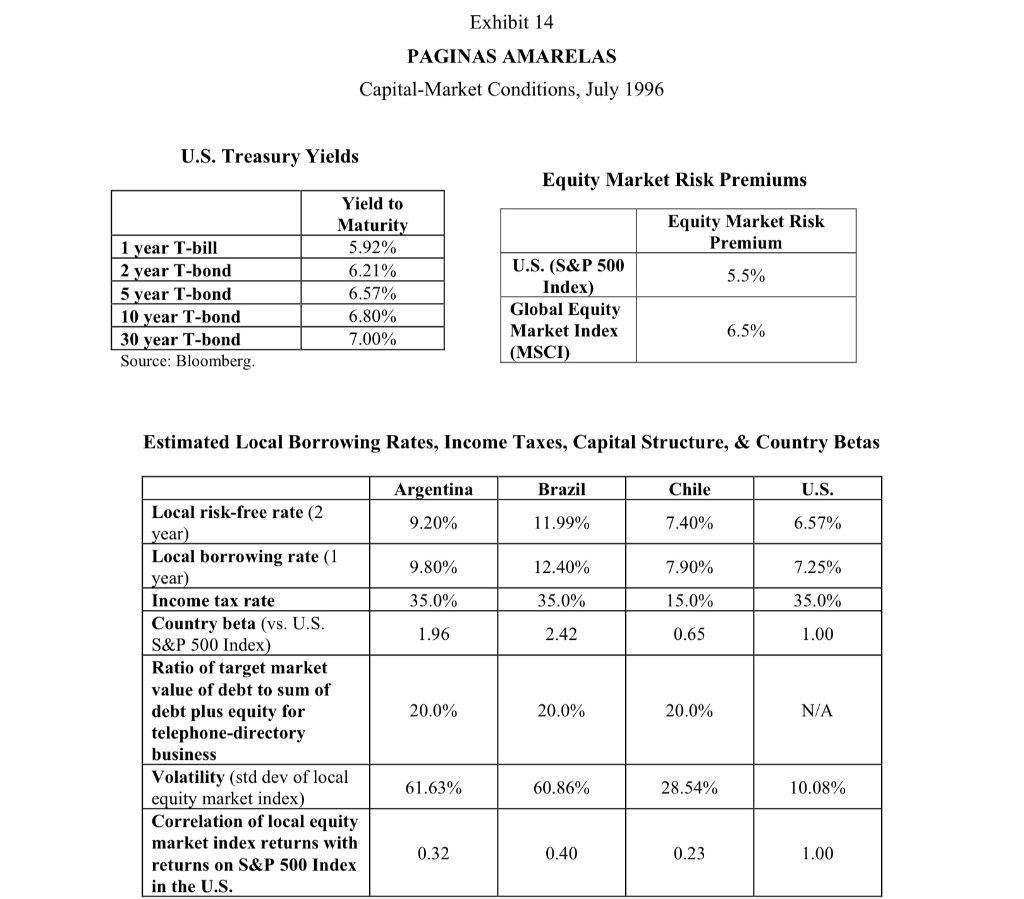
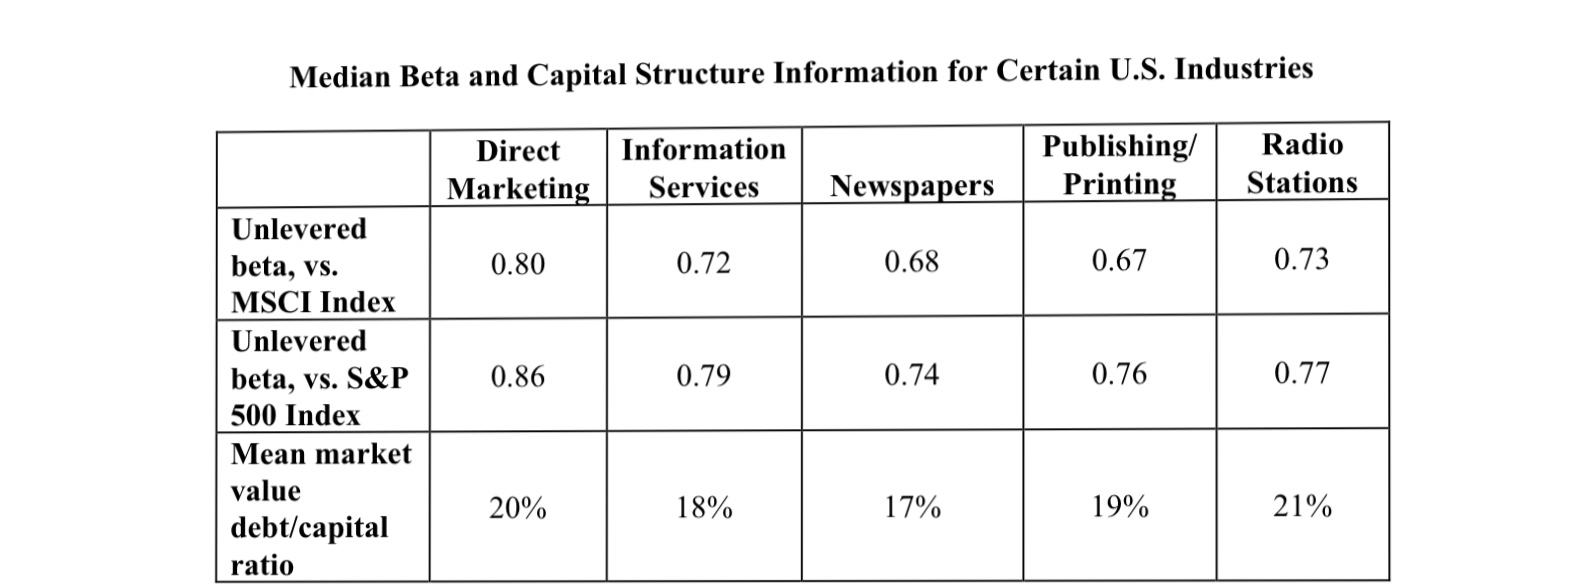
Determining the cost of debt Lopez needed to estimate the WACC with which to discount free cash flows from Argentina, Brazil, and Chile. He decided to start with the easiest part, estimating the cost of debt. Brasil Investimentos' executives had stated that the country operations had not borrowed money at the corporate level or as one entity (i.e., the three country operations together as the telephone-directory subsidiary), but only at the country level. Lopez's assessment was that all three local operations were relatively small to issue debt independently in the international markets. They would have to rely on the local markets for their borrowing needs. With that in mind, Lopez called J.P. Morgan bankers working at the credit department in offices located in the three countries. He was able to get from them an estimate of the U.S. dollar rates at which each country unit could expect to borrow (see Exhibit 14 for estimated borrowing rates, tax rates, and long-term capital structure). Determining the cost of equity In pursuing the next step, calculating the cost of equity, Lopez could choose between two different approaches under the CAPM method (capital asset pricing model). One approach would be to use local markets' parameters (local risk-free rate, local-market premium, and beta). The other approach would be to use U.S. market parameters to come up with a cost of equity, which would then be adjusted to reflect the country risk. The first path offered several difficulties. Lopez had problems in determining a risk-free rate for each country. He questioned whether there was such a thing as a risk-free rate for countries like Argentina, Brazil, and Chile. He knew that even sovereign bonds, like Brady bonds, 4 offered risk of default, because the governments of these countries had defaulted on debt and interest payments in the recent past. Exhibit 14 PAGINAS AMARELAS Capital-Market Conditions, July 1996 U.S. Treasury Yields Equity Market Risk Premiums Equity Market Risk Premium Yield to Maturity 5.92% 6.21% 6.57% 6.80% 7.00% 1 year T-bill 2 year T-bond 5 year T-bond 10 year T-bond 30 year T-bond Source: Bloomberg 5.5% U.S. (S&P 500 Index) Global Equity Market Index ( MSCI) 6.5% Estimated Local Borrowing Rates, Income Taxes, Capital Structure, & Country Betas Argentina Brazil Chile U.S. 9.20% 11.99% 7.40% 6.57% 9.80% 12.40% 7.90% 7.25% 35.0% 35.0% 15.0% 35.0% 1.96 2.42 0.65 1.00 Local risk-free rate (2 year) Local borrowing rate (1 year) Income tax rate Country beta (vs. U.S. S&P 500 Index) Ratio of target market value of debt to sum of debt plus equity for telephone-directory business Volatility (std dev of local equity market index) Correlation of local equity market index returns with returns on S&P 500 Index in the U.S. 20.0% 20.0% 20.0% N/A 61.63% 60.86% 28.54% 10.08% 0.32 0.40 0.23 1.00 Median Beta and Capital Structure Information for Certain U.S. Industries Direct Marketing Information Services Publishing Printing Radio Stations Newspapers 0.80 0.72 0.68 0.67 0.73 0.86 0.79 0.74 0.76 0.77 Unlevered beta, vs. MSCI Index Unlevered beta, vs. S&P 500 Index Mean market value debt/capital ratio 20% 18% 17% 19% 21% Determining the cost of debt Lopez needed to estimate the WACC with which to discount free cash flows from Argentina, Brazil, and Chile. He decided to start with the easiest part, estimating the cost of debt. Brasil Investimentos' executives had stated that the country operations had not borrowed money at the corporate level or as one entity (i.e., the three country operations together as the telephone-directory subsidiary), but only at the country level. Lopez's assessment was that all three local operations were relatively small to issue debt independently in the international markets. They would have to rely on the local markets for their borrowing needs. With that in mind, Lopez called J.P. Morgan bankers working at the credit department in offices located in the three countries. He was able to get from them an estimate of the U.S. dollar rates at which each country unit could expect to borrow (see Exhibit 14 for estimated borrowing rates, tax rates, and long-term capital structure). Determining the cost of equity In pursuing the next step, calculating the cost of equity, Lopez could choose between two different approaches under the CAPM method (capital asset pricing model). One approach would be to use local markets' parameters (local risk-free rate, local-market premium, and beta). The other approach would be to use U.S. market parameters to come up with a cost of equity, which would then be adjusted to reflect the country risk. The first path offered several difficulties. Lopez had problems in determining a risk-free rate for each country. He questioned whether there was such a thing as a risk-free rate for countries like Argentina, Brazil, and Chile. He knew that even sovereign bonds, like Brady bonds, 4 offered risk of default, because the governments of these countries had defaulted on debt and interest payments in the recent past. Exhibit 14 PAGINAS AMARELAS Capital-Market Conditions, July 1996 U.S. Treasury Yields Equity Market Risk Premiums Equity Market Risk Premium Yield to Maturity 5.92% 6.21% 6.57% 6.80% 7.00% 1 year T-bill 2 year T-bond 5 year T-bond 10 year T-bond 30 year T-bond Source: Bloomberg 5.5% U.S. (S&P 500 Index) Global Equity Market Index ( MSCI) 6.5% Estimated Local Borrowing Rates, Income Taxes, Capital Structure, & Country Betas Argentina Brazil Chile U.S. 9.20% 11.99% 7.40% 6.57% 9.80% 12.40% 7.90% 7.25% 35.0% 35.0% 15.0% 35.0% 1.96 2.42 0.65 1.00 Local risk-free rate (2 year) Local borrowing rate (1 year) Income tax rate Country beta (vs. U.S. S&P 500 Index) Ratio of target market value of debt to sum of debt plus equity for telephone-directory business Volatility (std dev of local equity market index) Correlation of local equity market index returns with returns on S&P 500 Index in the U.S. 20.0% 20.0% 20.0% N/A 61.63% 60.86% 28.54% 10.08% 0.32 0.40 0.23 1.00 Median Beta and Capital Structure Information for Certain U.S. Industries Direct Marketing Information Services Publishing Printing Radio Stations Newspapers 0.80 0.72 0.68 0.67 0.73 0.86 0.79 0.74 0.76 0.77 Unlevered beta, vs. MSCI Index Unlevered beta, vs. S&P 500 Index Mean market value debt/capital ratio 20% 18% 17% 19% 21%Step by Step Solution
There are 3 Steps involved in it
Step: 1

Get Instant Access to Expert-Tailored Solutions
See step-by-step solutions with expert insights and AI powered tools for academic success
Step: 2

Step: 3
Ace Your Homework with AI
Get the answers you need in no time with our AI-driven, step-by-step assistance
Get Started
Management Reporting Und Behavioral Accounting Verhaltenswirkungen Des Berichtswesens Im Unternehmen
Authors: Andreas Taschner
2nd., 2nd. Auflage Aufl. 2019 Edition
3658234911, 978-3658234911