

Answered step by step
Verified Expert Solution
Question
1 Approved Answer
Please explai and solve this question : Part II: Lab distillation Please support your explanations with screenshots of the simulation of Aspen whenever possible. In
Please explai and solve this question : Part II: Lab distillation
Please support your explanations with screenshots of the simulation of Aspen whenever possible.
In the technological hall, there is a distillation column containing n sieve trays. The column separates a mixture of ethanol and propanol under different reflux ratios. The vapor exiting the top tray is completely condensed using cooling water in a condenser. The reflux ratio is controlled by a valve in the reflux line, while the reboiler is electrically heated. Some trays are equipped with thermocouples to measure the temperature on these trays. In the lab, there is a lab manual available that explains how to manipulate the variables and interpret the physical data obtained from the column.
Assume during experiments, three samples are normally taken from different locations of the column: a sample from the top product, a sample from the middle stage, and a sample from the bottoms products. The composition of these samples are determined by a gas chromatograph GC
Initial conditions: feed is saturated liquid and has a mole ratio : for ethanol: propanol, pressure at atm. The reflux ratio R is assumed to be infinity case.
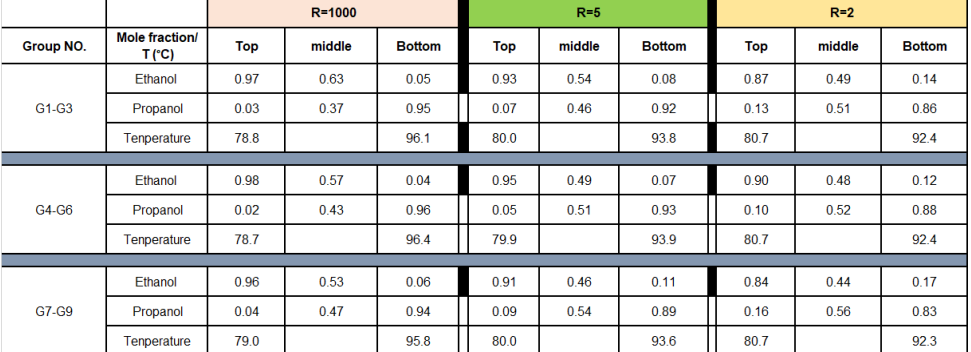
Experimental results: samples are taken different locations of the column under different reflux ratios are analysed by GC and the results are summarized in table below:
Use the data in the Picture attached for G ignore the rest of the data.
Make a schematic drawing of the setup.
Calculate the following variables based on the compositions obtained of each case
The minimum number of equilibrium stage
The actual number of stage
The minimum reflux ratio
The overall efficiency of the column
For the aforementioned calculation, please provide a clear list of symbols, any assumptions that you have made, and data you have cited from literature sources.
Based on the aforementioned data and results, what could you conclude, how would you formulate the objectives of the lab experiments. Quantitatively and qualitatively discuss how to determine the optimal operation conditions.
Based on the figure viscosityvolatility what is the expected overall tray efficiency for the distillation process described above? Additionally, what recommendations would you make to improve the overall tray efficiency?
If we want to separate a mixture of methanol and propanol instead of ethanol and propanol to meet the same product specifications with the same reflux ratio, would we require a higher or shorter column? Please explain your answer with support of simulation results.
Step by Step Solution
There are 3 Steps involved in it
Step: 1

Get Instant Access to Expert-Tailored Solutions
See step-by-step solutions with expert insights and AI powered tools for academic success
Step: 2

Step: 3
Ace Your Homework with AI
Get the answers you need in no time with our AI-driven, step-by-step assistance
Get Started
Essential Practices For Managing Chemical Reactivity Hazards
Authors: Robert W. Johnson, Steven W. Rudy, Stephen D. Unwin
1st Edition
0816908966, 978-0816908967