

Answered step by step
Verified Expert Solution
Question
1 Approved Answer
Please explain a summary of profitability in less than 5 sentances based on graphs. Please explain a summary of stability in less than 5 sentances
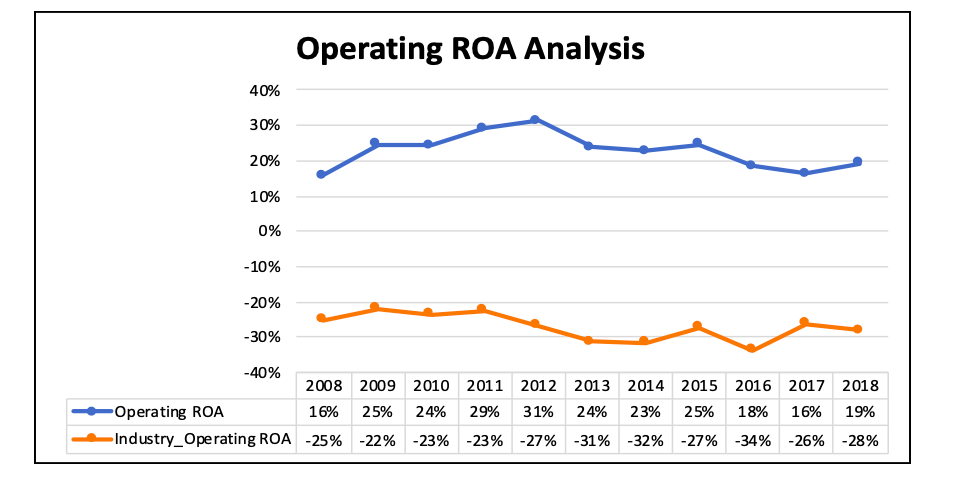 Please explain a summary of profitability in less than 5 sentances based on graphs.
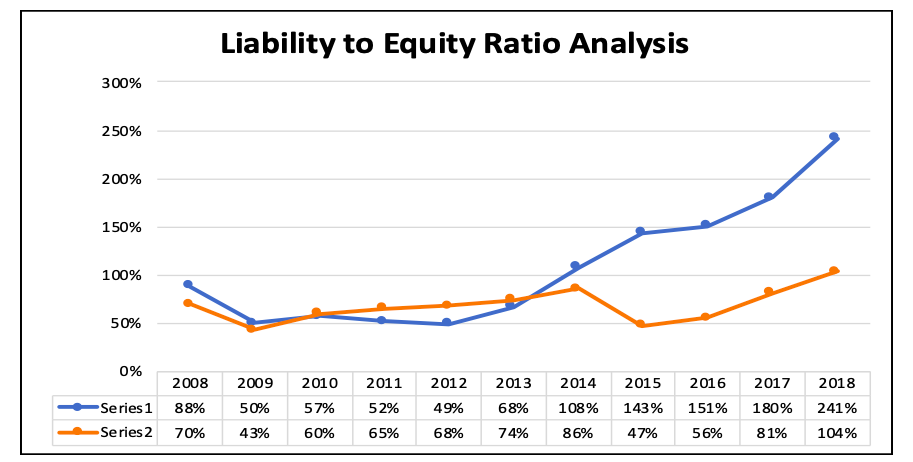
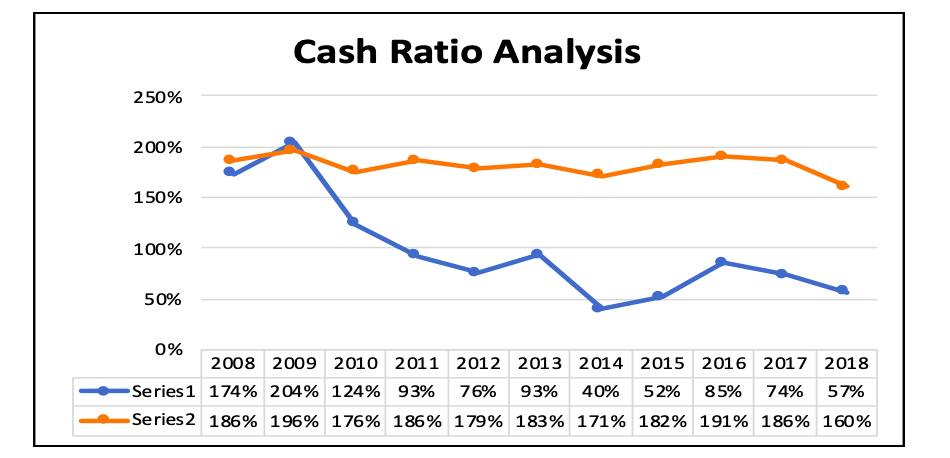
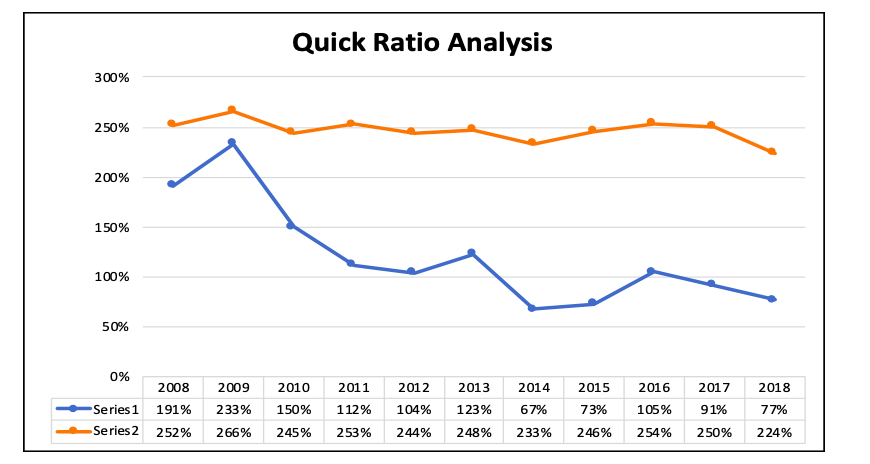
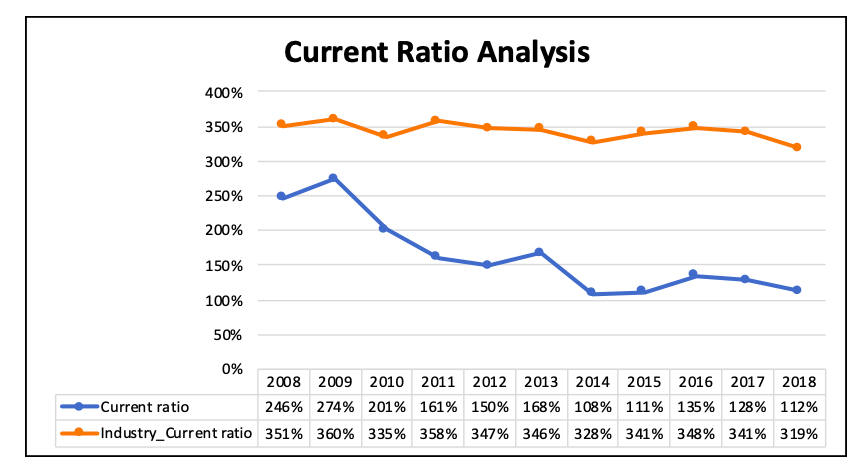
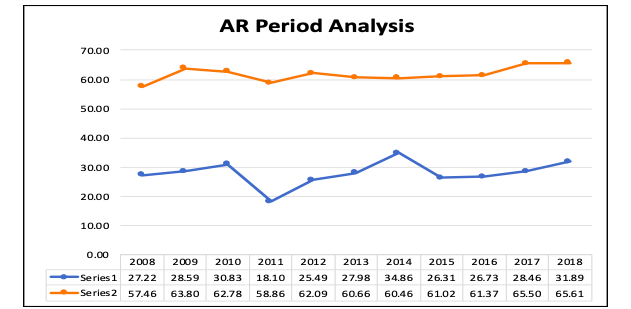
Please explain a summary of stability in less than 5 sentances based on graphs.
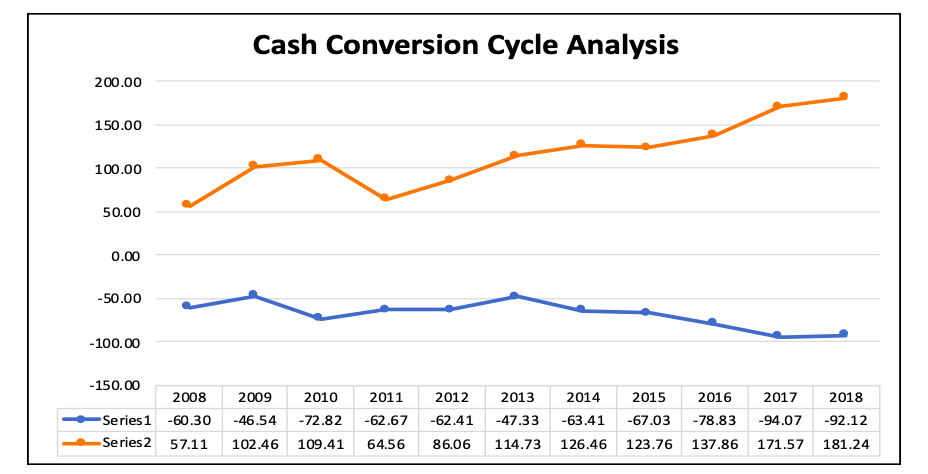
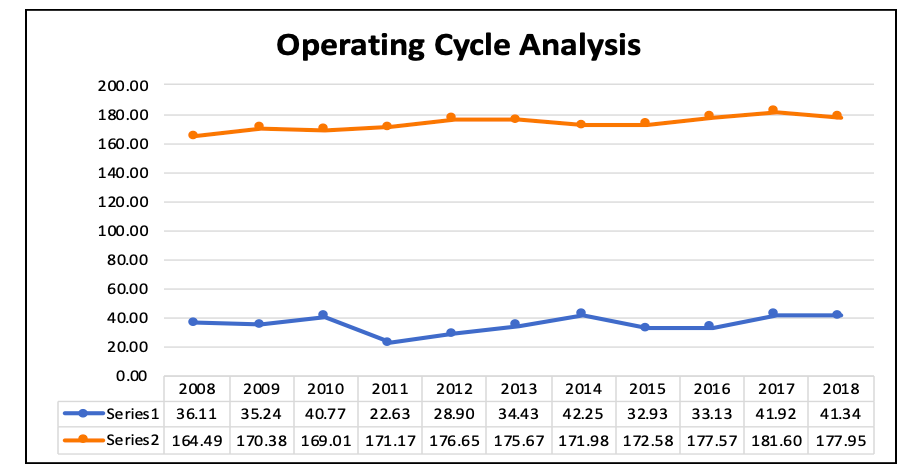
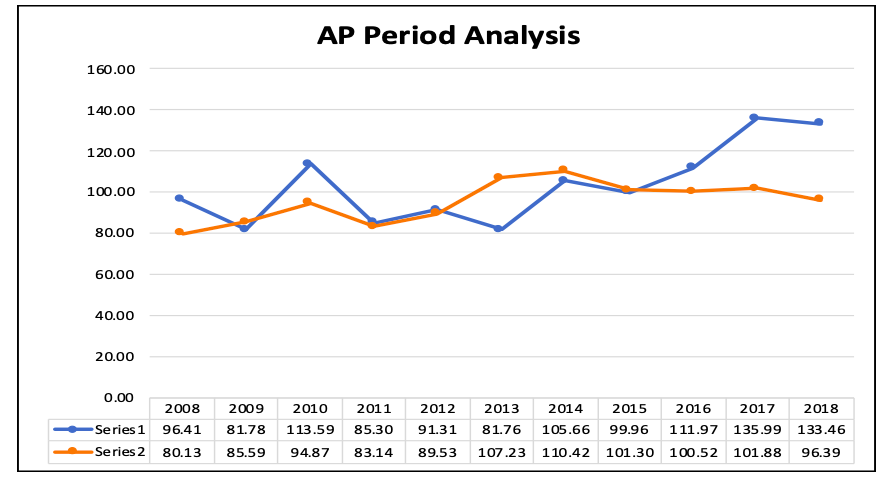
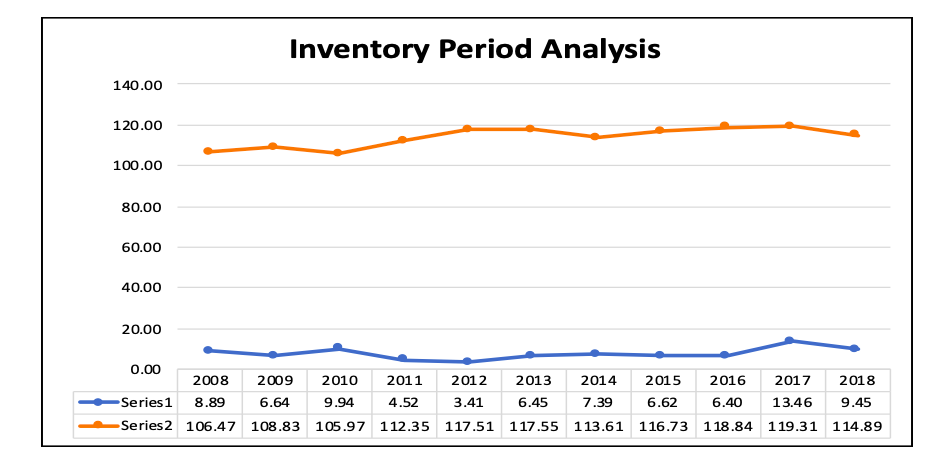
Blue is the company.
Orange is the industry.
Cash Conversion Cycle Analysis 200.00 150.00 100.00 50.00 0.00 -50.00 -100.00 -150.00 2008 -Series 1 -60.30 Series 2 57.11 2009 -46.54 102.46 2010 -72.82 109.41 2011 -62.67 2012 -62.41 86.06 2013 -47.33 114.73 2014 2015 2016 -63.41 -67.03 -78.83 126.46 123.76 137.86 2017 -94.07 171.57 2018 -92.12 181.24 64.56 Operating Cycle Analysis 200.00 180.00 160.00 140.00 120.00 100.00 80.00 60.00 40.00 20.00 0.00 2008 2009 2010 2011 2012 2013 2014 2015 2016 2017 2018 -Series 1 36.11 35.24 40.77 22.63 28.90 34.43 42.25 32.93 33.13 41.92 41.34 Series 2 164.49 170.38 169.01 171.17 176.65 175.67 171.98 172.58 177.57 181.60 177.95 AP Period Analysis 160.00 140.00 120.00 100.00 80.00 60.00 40.00 20.00 2009 0.00 2008 -Series 1 96.41 Series 2 80.13 81.78 2010 113.59 94.87 2011 85.30 83.14 2012 91.31 89.53 2013 2014 2015 81.76 105.66 99.96 107.23 110.42 101.30 2016 2017 2018 111.97 135.99 133.46 100.52 101.88 96.39 85.59 Inventory Period Analysis 140.00 120.00 100.00 80.00 60.00 40.00 20.00 0.00 2008 2009 2010 2011 2012 2013 2014 2015 2016 2017 2018 Series 1 8.89 6.64 9.94 4.52 3.41 6.45 7.39 6.62 6.40 13.46 9.45 Series 2 106.47 108.83 105.97 112.35 117.51 117.55 113.61 116.73 118.84 119.31 114.89 Liability to Equity Ratio Analysis 300% 250% 200% 150% 100% 50% 0% 2015 2008 -Series 1 88% Series 2 70% 2009 50% 2010 57% 60% 2011 52% 65% 2012 49% 2013 68% 74% 2014 108% 86% 143% 2016 151% % 2017 180% 81% 2018 241% 104% 43% 68% 47% 56% Cash Ratio Analysis 250% 200% 150% 100% 50% 0% 2008 2009 2010 2011 2012 2013 2014 2015 2016 2017 2018 -Series 1 174% 204% 124% 93% 76% 93% 40% 52% 85% 74% 57% -Series2 186% 196% 176% 186% 179% 183% 171% 182% 191% 186% 160% Quick Ratio Analysis 300% 250% 200% 150% 100% 50% 2010 2011 2012 2013 2014 2015 2016 2017 2018 0% 2008 -Series 1 191% Series 2 252% 2009 2 33% 150% 112% 104% 123% 67% 73% 105% 91% 77% 266% 245% 2.53% 244% 248% 2 33% 246% 254% 250% 224% Current Ratio Analysis 400% 350% 300% 250% 200% 150% 100% 50% 0% 2008 2009 2010 2011 2012 2013 2014 2015 2016 2017 2018 Current ratio 246% 274% 201% 161% 150% 168% 108% 111% 135% 128% 112% - Industry_Current ratio 351% 360% 335% 358% 347% 346% 328% 341% 348% 341% 319% AR Period Analysis 70.00 60.00 50.00 40.00 30.00 20.00 10.00 2012 2018 0.00 2008 Series 1 27.22 Series 2 57.46 2009 28.59 2010 30.83 62.78 2011 18.10 58.86 2013 27.98 60.66 2014 34.86 60.46 2015 26.31 25.49 62.09 2016 26.73 61.37 2017 28.46 31.89 65.61 63.80 6102 65.50 Operating ROA Analysis 40% 30% 20% 10% 0% -10% -20% -30% -40% 2008 2009 2010 2011 2012 2013 2014 2015 2016 2017 2018 Operating ROA 16% 25% 24% 29% 31% 24% 23% 25% 18% 16% 19% - Industry_Operating ROA -25% -22% -23% -23% -27% -31% -32% -27% -34% -26% -28%Step by Step Solution
There are 3 Steps involved in it
Step: 1

Get Instant Access to Expert-Tailored Solutions
See step-by-step solutions with expert insights and AI powered tools for academic success
Step: 2

Step: 3
Ace Your Homework with AI
Get the answers you need in no time with our AI-driven, step-by-step assistance
Get Started