

Answered step by step
Verified Expert Solution
Question
1 Approved Answer
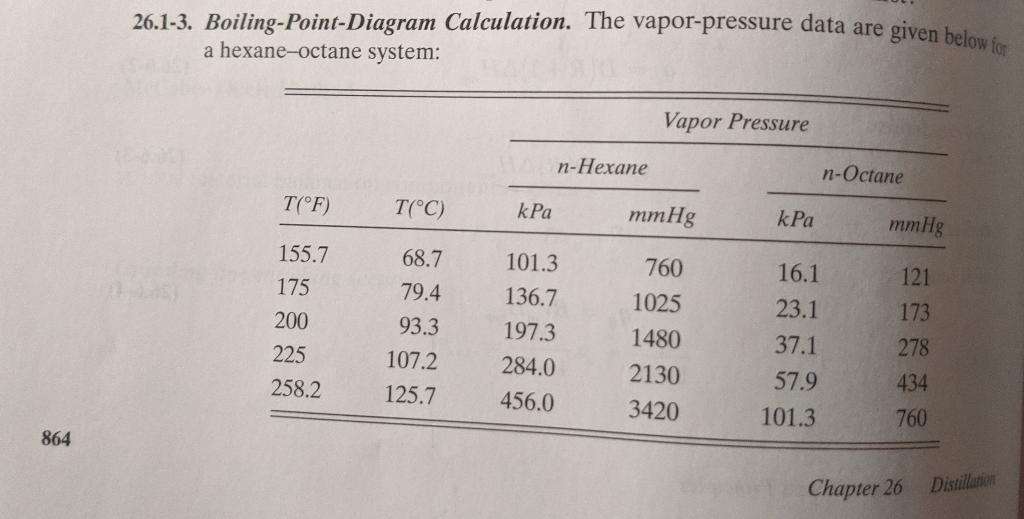
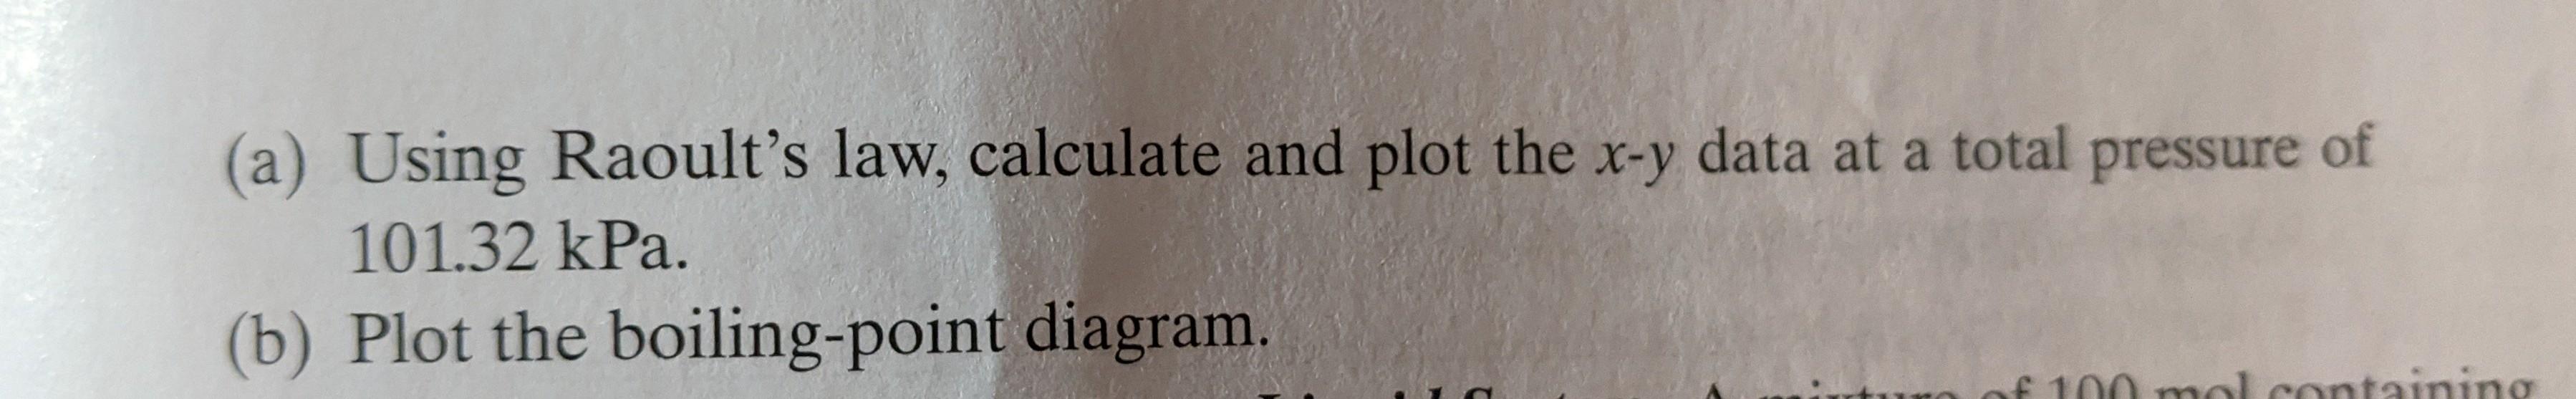
Please explain how to graph this data. 26.1-3. Boiling-Point-Diagram Calculation. The vapor-pressure data are given below for a hexane-octane system: Vapor Pressure n-Hexane n-Octane T(F)
Please explain how to graph this data.
Step by Step Solution
There are 3 Steps involved in it
Step: 1

Get Instant Access to Expert-Tailored Solutions
See step-by-step solutions with expert insights and AI powered tools for academic success
Step: 2

Step: 3
Ace Your Homework with AI
Get the answers you need in no time with our AI-driven, step-by-step assistance
Get Started
Chemical Engineering Design And Analysis An Introduction
Authors: T. Michael Duncan, Jeffrey A. Reimer
2nd Edition
1108421474, 9781108421478