Answered step by step
Verified Expert Solution
Question
1 Approved Answer
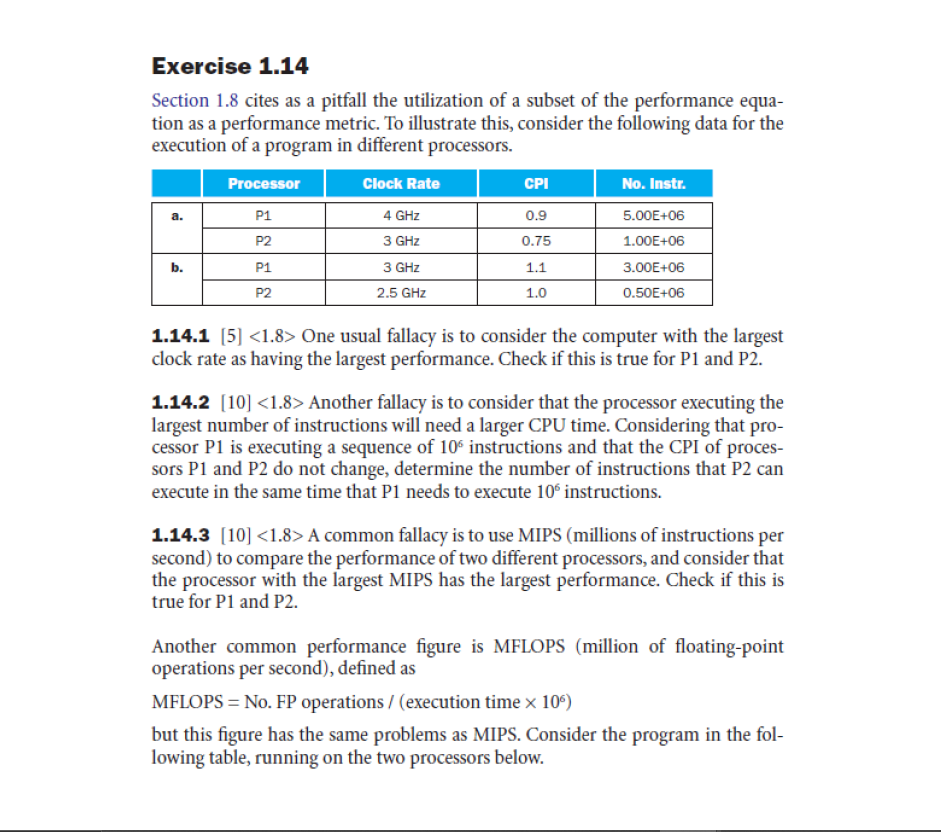
Please explain the answers so that I can understand it as well. Exercise 1.14 Section 1.8 cites as a pitfall the utilization of a subset
Please explain the answers so that I can understand it as well.
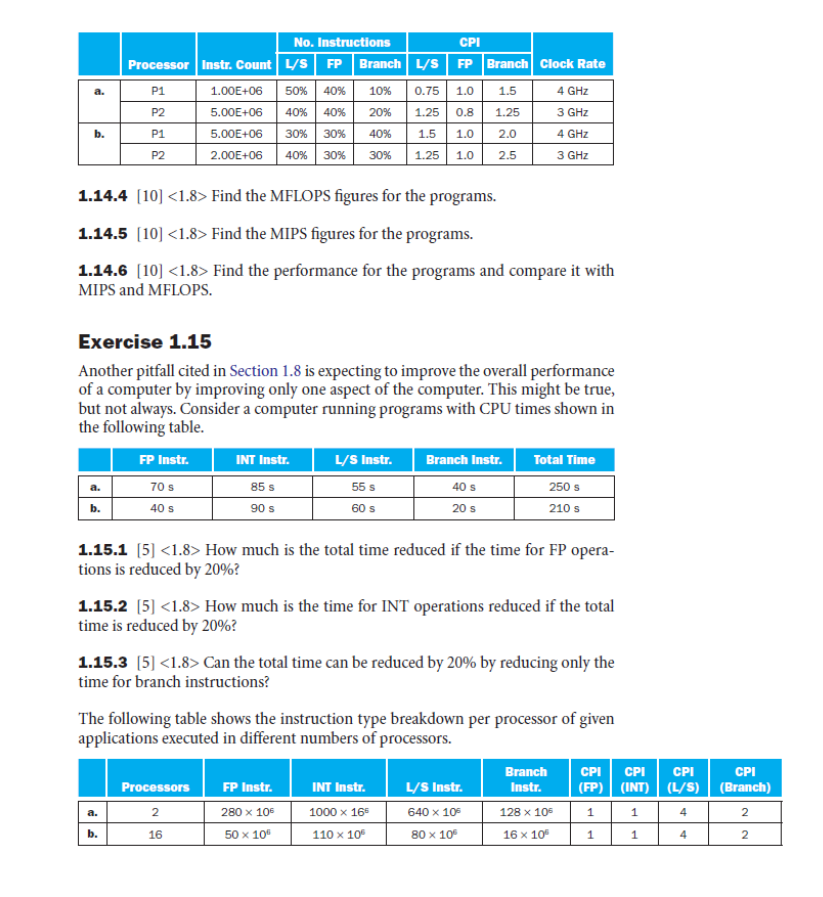
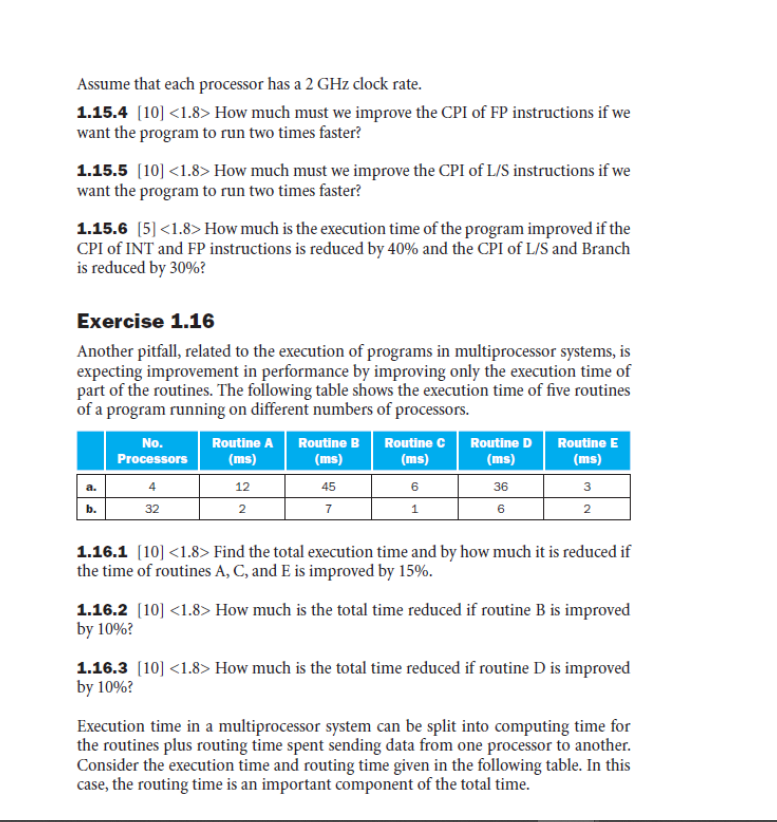
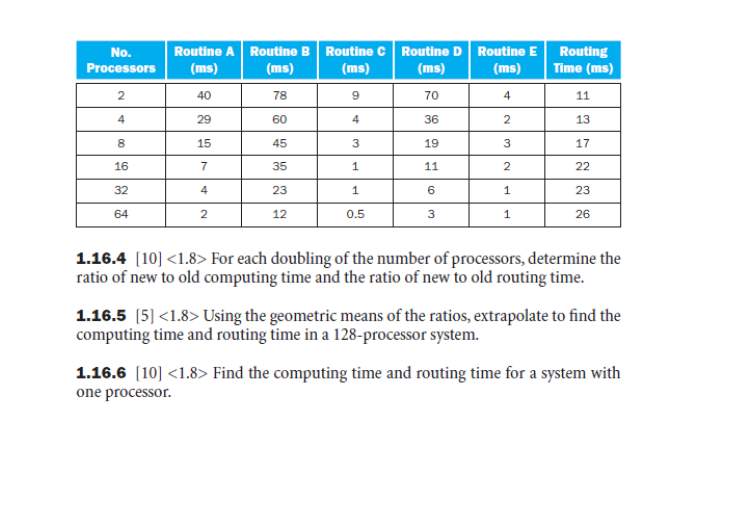
Exercise 1.14 Section 1.8 cites as a pitfall the utilization of a subset of the performance equa- tion as a performance metric. To illustrate this, consider the following data for the execution of a program in different processors. Processor Clock Rate CPI No. Instr. P1 4 GHz 0.9 5.00E+06 P2 3 GHz 0.75 1.00E+06 P1 3 GHz 1.1 3.00E+06 P2 2.5 GHz 1.0 0.50E+06 b. 1.14.1 [5] One usual fallacy is to consider the computer with the largest clock rate as having the largest performance. Check if this is true for P1 and P2. 1.14.2 [10] Another fallacy is to consider that the processor executing the largest number of instructions will need a larger CPU time. Considering that pro- cessor P1 is executing a sequence of 10 instructions and that the CPI of proces- sors P1 and P2 do not change, determine the number of instructions that P2 can execute in the same time that P1 needs to execute 10 instructions. 1.14.3 [10] A common fallacy is to use MIPS (millions of instructions per second) to compare the performance of two different processors, and consider that the processor with the largest MIPS has the largest performance. Check if this is true for P1 and P2. Another common performance figure is MFLOPS (million of floating-point operations per second), defined as MFLOPS = No. FP operations / (execution time x 106) but this figure has the same problems as MIPS. Consider the program in the fol- lowing table, running on the two processors below. a. No. Instructions Processor Instr. Count V/S FP Branch L/S FP Branch Clock Rate P1 1.00E+06 50% 40% 10% 0.75 1.0 1.5 4 GHz P2 5.00E+06 40% 40% 20% 1.25 0.8 1.25 3 GHz P1 5.00E+06 30% 30% 40% 1.5 1.0 2.0 4 GHz P2 2.00E+06 40% 30% 30% 1.25 1.0 2.5 3 GHz b. 1.14.4 [10] Find the MFLOPS figures for the programs. 1.14.5 [10] Find the MIPS figures for the programs. 1.14.6 [10] Find the performance for the programs and compare it with MIPS and MFLOPS. Exercise 1.15 Another pitfall cited in Section 1.8 is expecting to improve the overall performance of a computer by improving only one aspect of the computer. This might be true, but not always. Consider a computer running programs with CPU times shown in the following table. FP Instr. L/S Instr. Branch Instr. Total Time 70 s 85 s 55 s 40 s 250 s b. 40 s 60 s 20 s 210 s INT Instr. 90 s 1.15.1 [5] How much is the total time reduced if the time for FP opera- tions is reduced by 20%? 1.15.2 (5] How much is the time for INT operations reduced if the total time is reduced by 20%? 1.15.3 [5] Can the total time can be reduced by 20% by reducing only the time for branch instructions? The following table shows the instruction type breakdown per processor of given applications executed in different numbers of processors. Branch CPI CPI Processors FP Instr. INT Instr. L/S Instr. Instr. (FP) (INT) (L/S) (Branch) 280 x 10 1000 x 165 640 x 105 128 x 10 50 x 100 110 x 10 80 x 10 16 x 100 CPI CPI a. 2 1 1 4 2 b. 16 1 1 4 2 Assume that each processor has a 2 GHz clock rate. 1.15.4 [10] How much must we improve the CPI of FP instructions if we want the program to run two times faster? 1.15.5 [10] How much must we improve the CPI of L/S instructions if we want the program to run two times faster? 1.15.6 [5] How much is the execution time of the program improved if the CPI of INT and FP instructions is reduced by 40% and the CPI of L/S and Branch is reduced by 30%? Exercise 1.16 Another pitfall, related to the execution of programs in multiprocessor systems, is expecting improvement in performance by improving only the execution time of part of the routines. The following table shows the execution time of five routines of a program running on different numbers of processors. No. Processors Routine A (ms) Routine B (ms) Routinec (ms) Routine D (ms) Routine E (ms) 3 2 4 12 45 6 36 b. 32 2 7 1 6 1.16.1 [10] Find the total execution time and by how much it is reduced if the time of routines A, C, and E is improved by 15%. 1.16.2 [10] How much is the total time reduced if routine B is improved by 10%? 1.16.3 [10] How much is the total time reduced if routine D is improved by 10%? Execution time in a multiprocessor system can be split into computing time for the routines plus routing time spent sending data from one processor to another. Consider the execution time and routing time given in the following table. In this case, the routing time is an important component of the total time. No. Processors Routine A (ms) Routine B (ms) Routine C Routine D Routine E Routing (ms) (ms) (ms) Time (ms) 2 40 78 9 70 4 11 4 29 60 4 36 2 13 8 15 45 3 19 3 17 16 7 35 1 11 2 22 32 4 23 1 6 1 23 64 2 12 0.5 3 1 26 1.16.4 [10] For each doubling of the number of processors, determine the ratio of new to old computing time and the ratio of new to old routing time. 1.16.5 (5] Using the geometric means of the ratios, extrapolate to find the computing time and routing time in a 128-processor system. 1.16.6 [10] Find the computing time and routing time for a system with one processor. Exercise 1.14 Section 1.8 cites as a pitfall the utilization of a subset of the performance equa- tion as a performance metric. To illustrate this, consider the following data for the execution of a program in different processors. Processor Clock Rate CPI No. Instr. P1 4 GHz 0.9 5.00E+06 P2 3 GHz 0.75 1.00E+06 P1 3 GHz 1.1 3.00E+06 P2 2.5 GHz 1.0 0.50E+06 b. 1.14.1 [5] One usual fallacy is to consider the computer with the largest clock rate as having the largest performance. Check if this is true for P1 and P2. 1.14.2 [10] Another fallacy is to consider that the processor executing the largest number of instructions will need a larger CPU time. Considering that pro- cessor P1 is executing a sequence of 10 instructions and that the CPI of proces- sors P1 and P2 do not change, determine the number of instructions that P2 can execute in the same time that P1 needs to execute 10 instructions. 1.14.3 [10] A common fallacy is to use MIPS (millions of instructions per second) to compare the performance of two different processors, and consider that the processor with the largest MIPS has the largest performance. Check if this is true for P1 and P2. Another common performance figure is MFLOPS (million of floating-point operations per second), defined as MFLOPS = No. FP operations / (execution time x 106) but this figure has the same problems as MIPS. Consider the program in the fol- lowing table, running on the two processors below. a. No. Instructions Processor Instr. Count V/S FP Branch L/S FP Branch Clock Rate P1 1.00E+06 50% 40% 10% 0.75 1.0 1.5 4 GHz P2 5.00E+06 40% 40% 20% 1.25 0.8 1.25 3 GHz P1 5.00E+06 30% 30% 40% 1.5 1.0 2.0 4 GHz P2 2.00E+06 40% 30% 30% 1.25 1.0 2.5 3 GHz b. 1.14.4 [10] Find the MFLOPS figures for the programs. 1.14.5 [10] Find the MIPS figures for the programs. 1.14.6 [10] Find the performance for the programs and compare it with MIPS and MFLOPS. Exercise 1.15 Another pitfall cited in Section 1.8 is expecting to improve the overall performance of a computer by improving only one aspect of the computer. This might be true, but not always. Consider a computer running programs with CPU times shown in the following table. FP Instr. L/S Instr. Branch Instr. Total Time 70 s 85 s 55 s 40 s 250 s b. 40 s 60 s 20 s 210 s INT Instr. 90 s 1.15.1 [5] How much is the total time reduced if the time for FP opera- tions is reduced by 20%? 1.15.2 (5] How much is the time for INT operations reduced if the total time is reduced by 20%? 1.15.3 [5] Can the total time can be reduced by 20% by reducing only the time for branch instructions? The following table shows the instruction type breakdown per processor of given applications executed in different numbers of processors. Branch CPI CPI Processors FP Instr. INT Instr. L/S Instr. Instr. (FP) (INT) (L/S) (Branch) 280 x 10 1000 x 165 640 x 105 128 x 10 50 x 100 110 x 10 80 x 10 16 x 100 CPI CPI a. 2 1 1 4 2 b. 16 1 1 4 2 Assume that each processor has a 2 GHz clock rate. 1.15.4 [10] How much must we improve the CPI of FP instructions if we want the program to run two times faster? 1.15.5 [10] How much must we improve the CPI of L/S instructions if we want the program to run two times faster? 1.15.6 [5] How much is the execution time of the program improved if the CPI of INT and FP instructions is reduced by 40% and the CPI of L/S and Branch is reduced by 30%? Exercise 1.16 Another pitfall, related to the execution of programs in multiprocessor systems, is expecting improvement in performance by improving only the execution time of part of the routines. The following table shows the execution time of five routines of a program running on different numbers of processors. No. Processors Routine A (ms) Routine B (ms) Routinec (ms) Routine D (ms) Routine E (ms) 3 2 4 12 45 6 36 b. 32 2 7 1 6 1.16.1 [10] Find the total execution time and by how much it is reduced if the time of routines A, C, and E is improved by 15%. 1.16.2 [10] How much is the total time reduced if routine B is improved by 10%? 1.16.3 [10] How much is the total time reduced if routine D is improved by 10%? Execution time in a multiprocessor system can be split into computing time for the routines plus routing time spent sending data from one processor to another. Consider the execution time and routing time given in the following table. In this case, the routing time is an important component of the total time. No. Processors Routine A (ms) Routine B (ms) Routine C Routine D Routine E Routing (ms) (ms) (ms) Time (ms) 2 40 78 9 70 4 11 4 29 60 4 36 2 13 8 15 45 3 19 3 17 16 7 35 1 11 2 22 32 4 23 1 6 1 23 64 2 12 0.5 3 1 26 1.16.4 [10] For each doubling of the number of processors, determine the ratio of new to old computing time and the ratio of new to old routing time. 1.16.5 (5] Using the geometric means of the ratios, extrapolate to find the computing time and routing time in a 128-processor system. 1.16.6 [10] Find the computing time and routing time for a system with one processorStep by Step Solution
There are 3 Steps involved in it
Step: 1

Get Instant Access to Expert-Tailored Solutions
See step-by-step solutions with expert insights and AI powered tools for academic success
Step: 2

Step: 3

Ace Your Homework with AI
Get the answers you need in no time with our AI-driven, step-by-step assistance
Get Started


