

Answered step by step
Verified Expert Solution
Question
1 Approved Answer
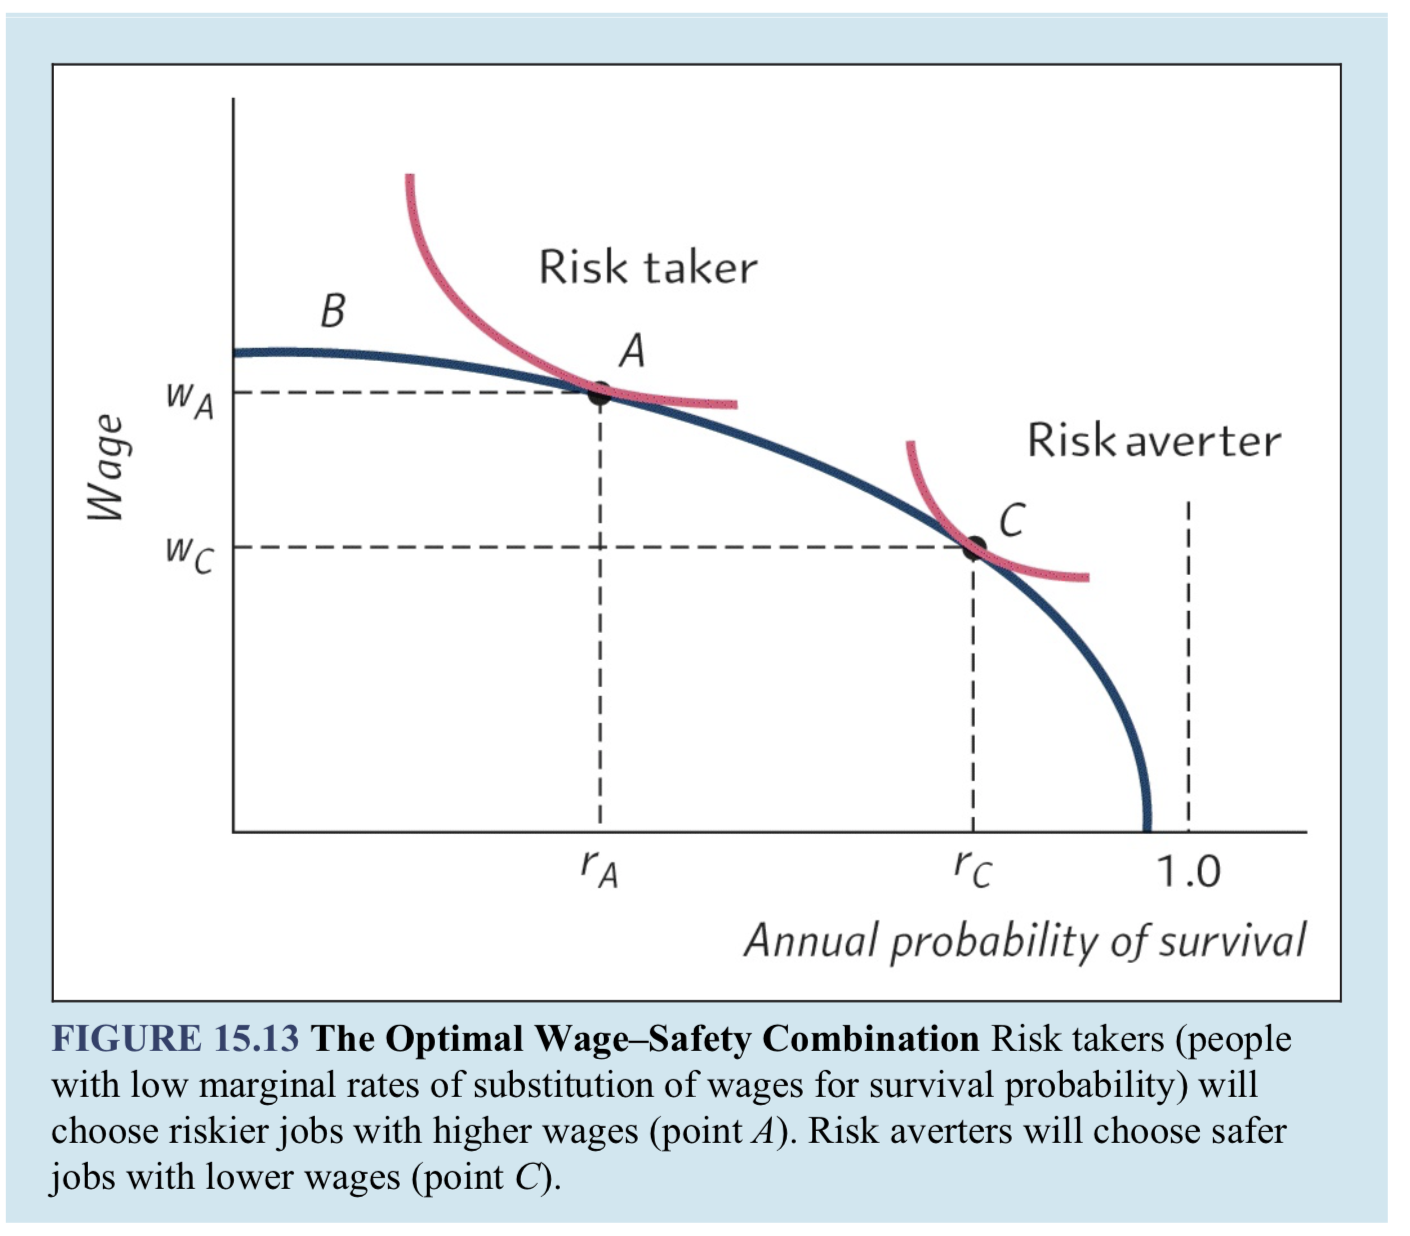
Please explain this graph thoroughly Risk taker Risk averter r C 1 .0 Annual probability of survival FIGURE 15.13 The Optimal WageSafety Combination Risk takers
Please explain this graph thoroughly
Step by Step Solution
There are 3 Steps involved in it
Step: 1

Get Instant Access with AI-Powered Solutions
See step-by-step solutions with expert insights and AI powered tools for academic success
Step: 2

Step: 3
Ace Your Homework with AI
Get the answers you need in no time with our AI-driven, step-by-step assistance
Get Started
Accounting Principles
Authors: Jerry J. Weygandt, Paul D. Kimmel, Donald E. Kieso
10th Edition
978-0470534793