please explain too my three question
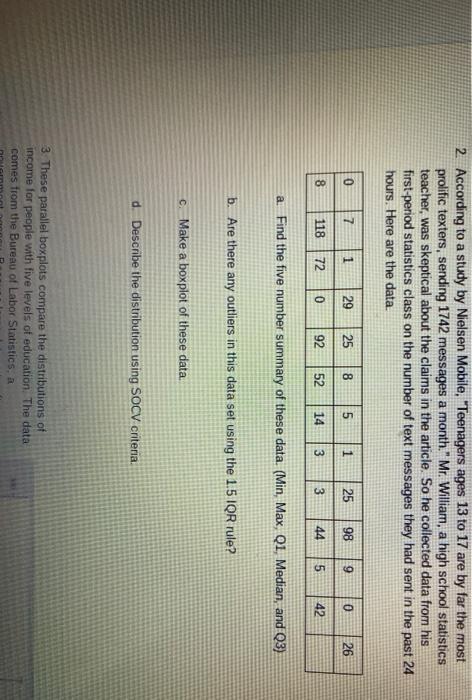
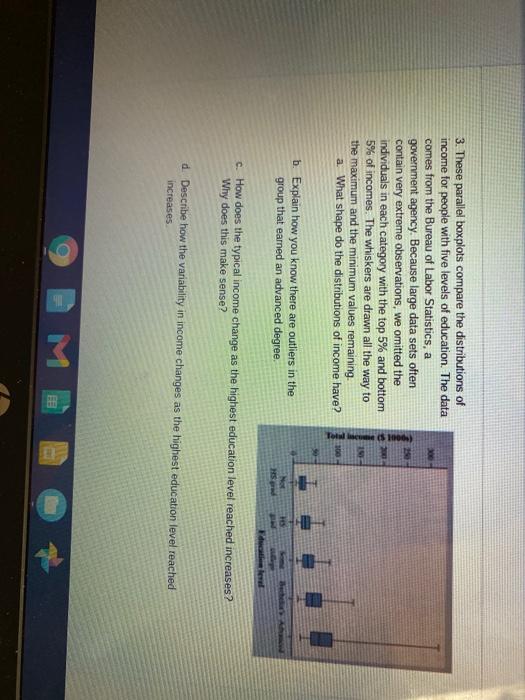
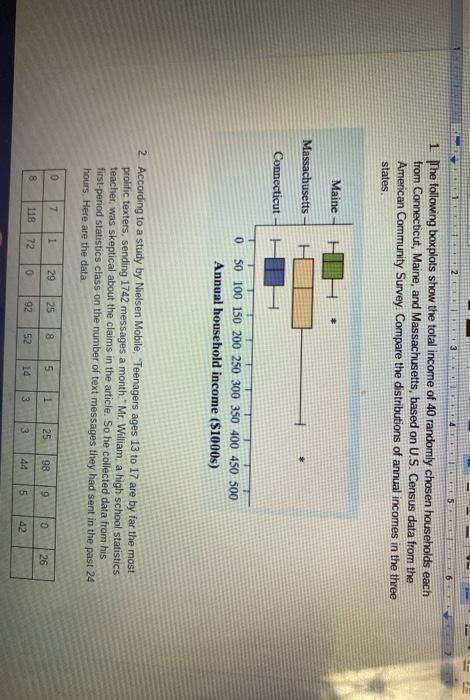
2 31 5 1 The following boxplots show the total income of 40 randomly chosen households each from Connecticut, Maine, and Massachusetts, based on U.S. Census data from the American Community Survey. Compare the distributions of annual incomes in the three states Maine Massachusetts * Connecticut 0 50 100 150 200 250 300 350 400 450 500 Annual household income ($1000s) 2. According to a study by Nielsen Mobile, Teenagers ages 13 to 17 are by far the most prolific texters, sending 1742 messages a month." Mr. William a high school statistics teacher, was skeptical about the claims in the article. So he collected data from his first-period statistics class on the number of text messages they had sent in the past 24 hours. Here are the data 0 7 1 29 25 8 5 1 25 98 9 0 26 8 118 72 92 52 14 3 3 44 on 42 2. According to a study by Nielsen Mobile, "Teenagers ages 13 to 17 are by far the most prolific texters, sending 1742 messages a month." Mr. William, a high school statistics teacher, was skeptical about the claims in the article. So he collected data from his first-period statistics class on the number of text messages they had sent in the past 24 hours. Here are the data. 0 7 1 29 25 8 5 1 25 98 9 0 26 8 118 72 0 92 52 14 3 3 44 5 42 a. Find the five number summary of these data. (Min, Max, Q1, Median, and Q3) b. Are there any outliers in this data set using the 1.5 IQR rule? c. Make a boxplot of these data d. Describe the distribution using SOCV criteria. 3. These parallel boxplots compare the distributions of income for people with five levels of education. The data comes from the Bureau of Labor Statistics, a 3. These parallel boxplots compare the distributions of income for people with five levels of education. The data comes from the Bureau of Labor Statistics, a government agency. Because large data sets often contain very extreme observations, we omitted the individuals in each category with the top 5% and bottom 5% of incomes. The whiskers are drawn all the way to the maximum and the minimum values remaining a What shape do the distributions of income have? (9900 99 1 Totallic 300 b. Explain how you know there are outliers in the group that earned an advanced degree. MS Falevel c. How does the typical income change as the highest education level reached increases? Why does this make sense? d Describe how the variability in income changes as the highest education level reached increases 2 31 5 1 The following boxplots show the total income of 40 randomly chosen households each from Connecticut, Maine, and Massachusetts, based on U.S. Census data from the American Community Survey. Compare the distributions of annual incomes in the three states Maine Massachusetts * Connecticut 0 50 100 150 200 250 300 350 400 450 500 Annual household income ($1000s) 2. According to a study by Nielsen Mobile, Teenagers ages 13 to 17 are by far the most prolific texters, sending 1742 messages a month." Mr. William a high school statistics teacher, was skeptical about the claims in the article. So he collected data from his first-period statistics class on the number of text messages they had sent in the past 24 hours. Here are the data 0 7 1 29 25 8 5 1 25 98 9 0 26 8 118 72 92 52 14 3 3 44 on 42 2. According to a study by Nielsen Mobile, "Teenagers ages 13 to 17 are by far the most prolific texters, sending 1742 messages a month." Mr. William, a high school statistics teacher, was skeptical about the claims in the article. So he collected data from his first-period statistics class on the number of text messages they had sent in the past 24 hours. Here are the data. 0 7 1 29 25 8 5 1 25 98 9 0 26 8 118 72 0 92 52 14 3 3 44 5 42 a. Find the five number summary of these data. (Min, Max, Q1, Median, and Q3) b. Are there any outliers in this data set using the 1.5 IQR rule? c. Make a boxplot of these data d. Describe the distribution using SOCV criteria. 3. These parallel boxplots compare the distributions of income for people with five levels of education. The data comes from the Bureau of Labor Statistics, a 3. These parallel boxplots compare the distributions of income for people with five levels of education. The data comes from the Bureau of Labor Statistics, a government agency. Because large data sets often contain very extreme observations, we omitted the individuals in each category with the top 5% and bottom 5% of incomes. The whiskers are drawn all the way to the maximum and the minimum values remaining a What shape do the distributions of income have? (9900 99 1 Totallic 300 b. Explain how you know there are outliers in the group that earned an advanced degree. MS Falevel c. How does the typical income change as the highest education level reached increases? Why does this make sense? d Describe how the variability in income changes as the highest education level reached increases