

Answered step by step
Verified Expert Solution
Question
1 Approved Answer
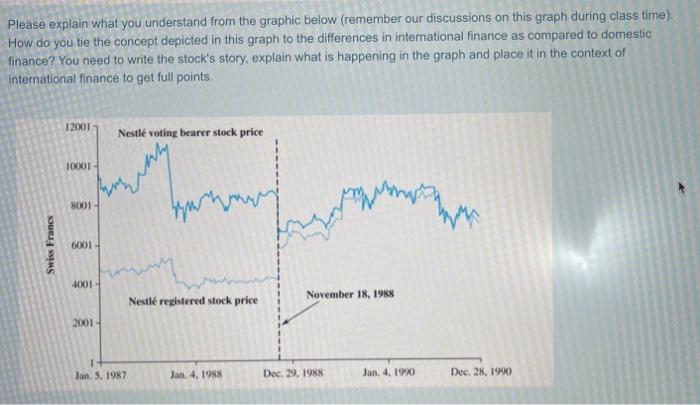
Please explain what you understand from the graphic below (remember our discussions on this graph during class time) How do you tie the concept depicted
Step by Step Solution
There are 3 Steps involved in it
Step: 1

Get Instant Access to Expert-Tailored Solutions
See step-by-step solutions with expert insights and AI powered tools for academic success
Step: 2

Step: 3
Ace Your Homework with AI
Get the answers you need in no time with our AI-driven, step-by-step assistance
Get Started
Consolidation In The European Financial Industry
Authors: R. Bottiglia, E. Gualandri , G. Mazzocco
1st Edition
0230233228,0230275028