

Answered step by step
Verified Expert Solution
Question
1 Approved Answer
please fill in the yellow. the first two pictures are just information for the question. please make sure each cell is filled in, in the
please fill in the yellow. the first two pictures are just information for the question.
please make sure each cell is filled in, in the yellow.
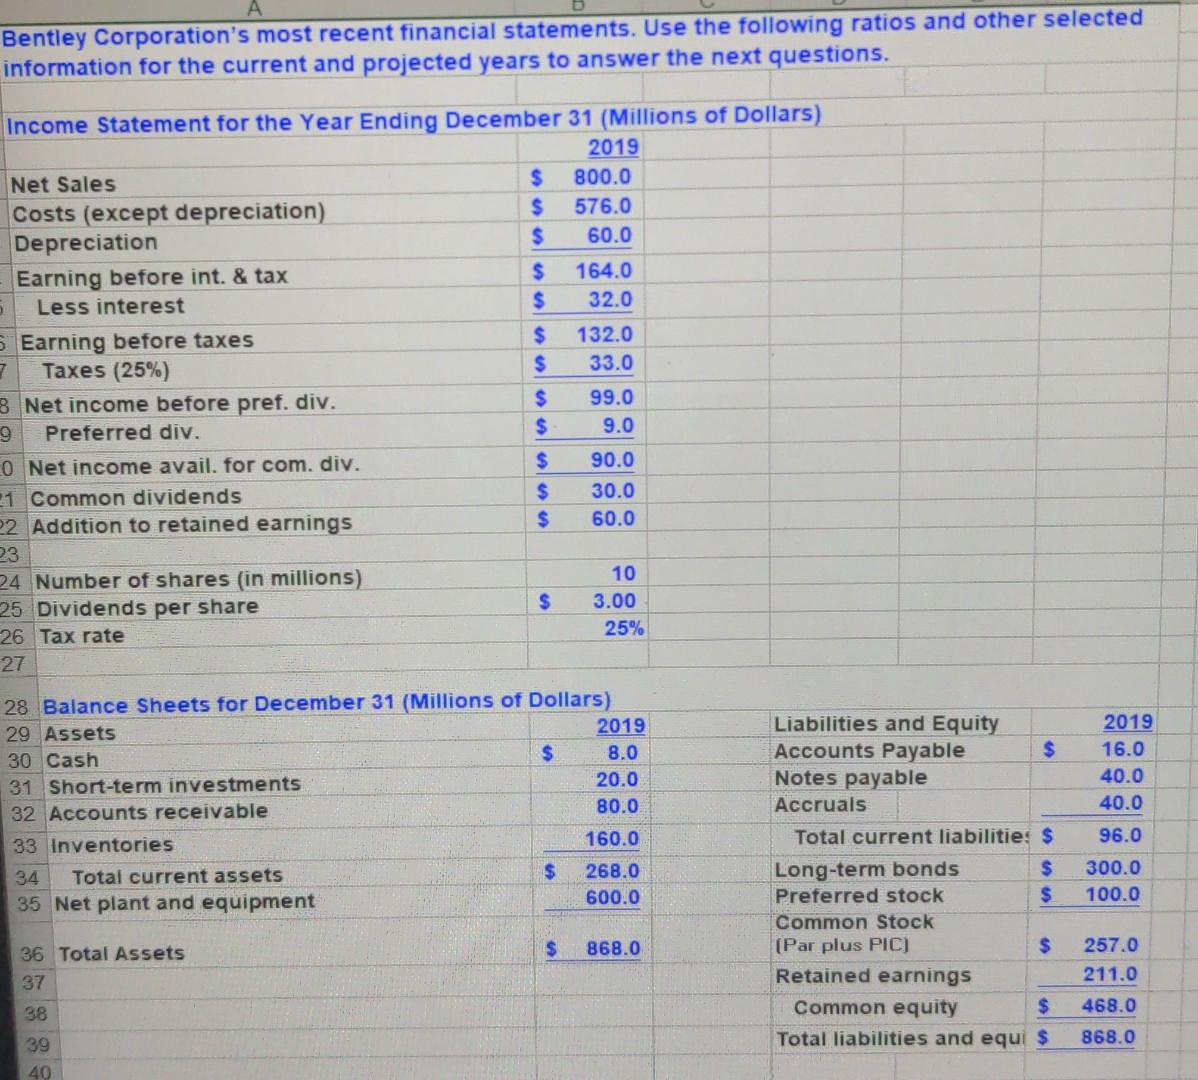
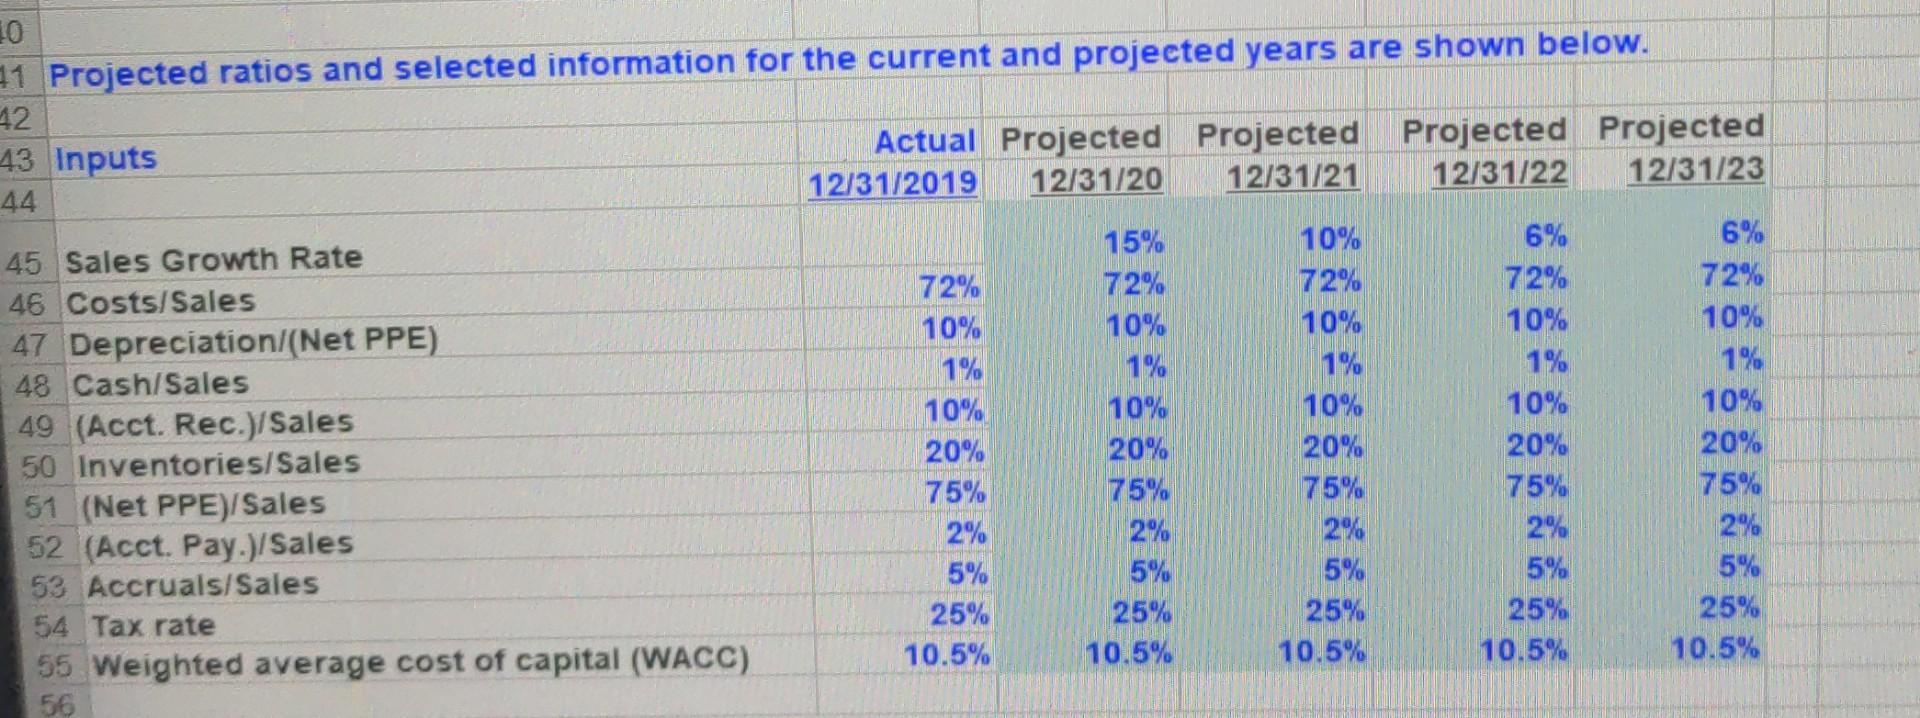
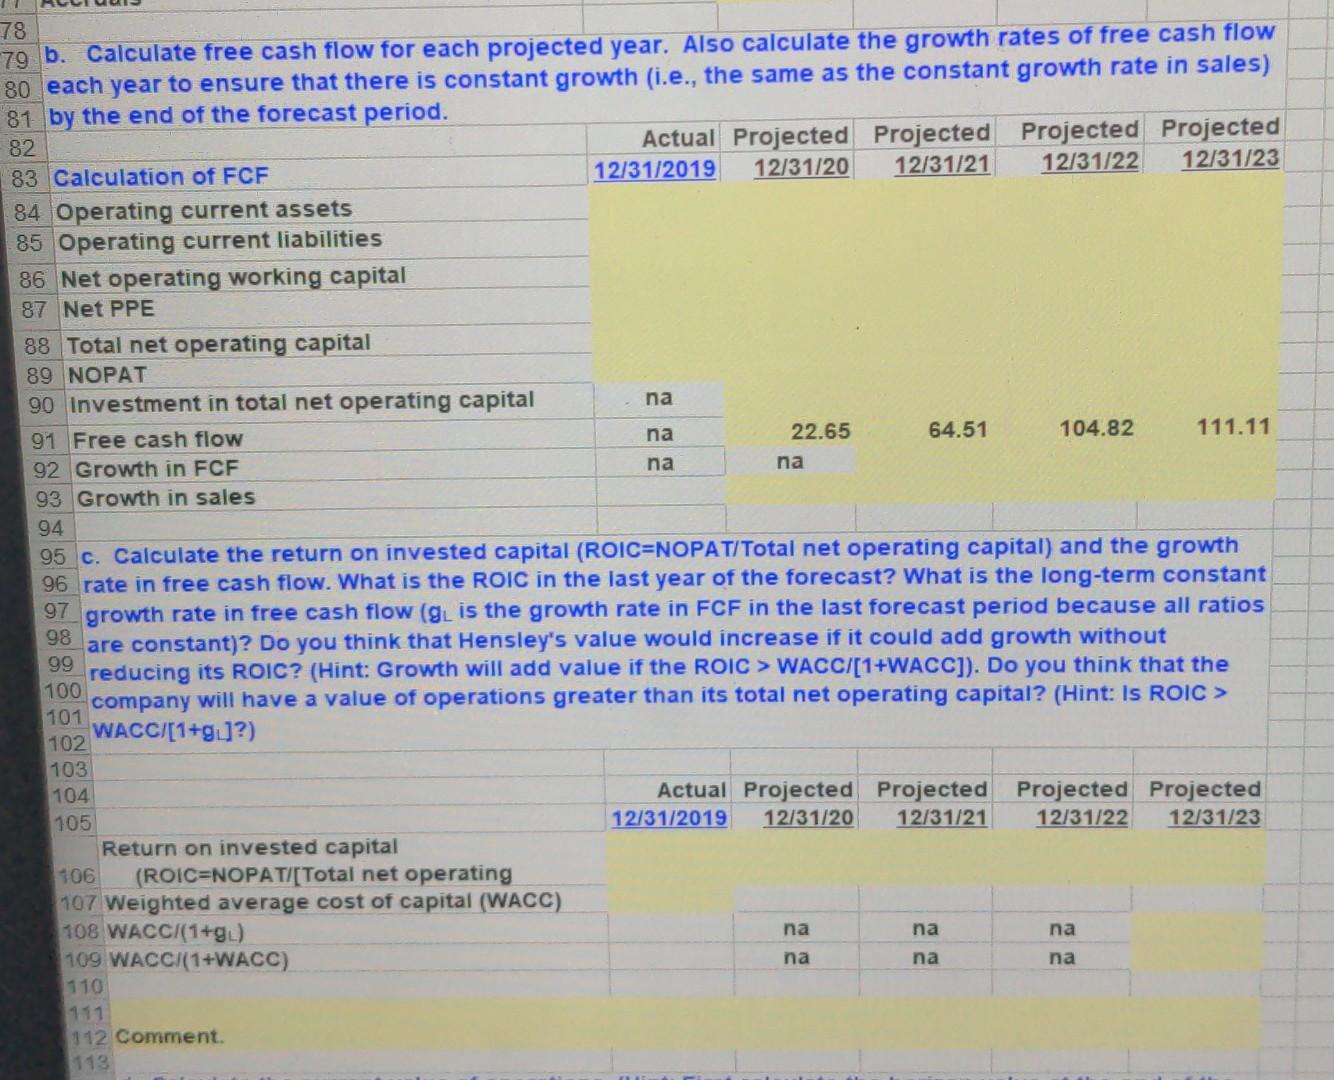
Bentley Corporation's most recent financial statements. Use the following ratios and other selected information for the current and projected years to answer the next questions. Income Statement for the Year Ending December 31 (Millions of Dollars) 2019 Net Sales $ 800.0 Costs (except depreciation) $ 576.0 Depreciation $ 60.0 Earning before int. & tax $ 164.0 Less interest $ 32.0 5 Earning before taxes $ 132.0 7 Taxes (25%) $ 33.0 B Net income before pref. div. $ 99.0 9 Preferred div. $ 9.0 0 Net income avail. for com. div. $ 90.0 1 Common dividends $ 30.0 22 Addition to retained earnings $ 60.0 23 24 Number of shares (in millions) 10 25 Dividends per share $ 3.00 26 Tax rate 25% 27 28 Balance Sheets for December 31 (Millions of Dollars) 29 Assets 2019 30 Cash $ 8.0 31 Short-term investments 20.0 32 Accounts receivable 80.0 33 Inventories 160.0 34 Total current assets $ 268.0 35 Net plant and equipment 600.0 2019 16.0 40.0 40.0 96.0 Liabilities and Equity Accounts Payable $ Notes payable Accruals Total current liabilitie: $ Long-term bonds $ Preferred stock $ Common Stock (Par plus PIC) $ Retained earnings Common equity $ Total liabilities and equi $ 300.0 100.0 $ 868.0 257.0 211.0 36 Total Assets 37 38 468.0 868.0 39 40 10 #1 Projected ratios and selected information for the current and projected years are shown below. 42 43 Inputs Actual Projected Projected Projected Projected 12/31/2019 12/31/20 12/31/21 12/31/22 12/31/23 44 72% 10% 1% 45 Sales Growth Rate 46 Costs/Sales 47 Depreciation/(Net PPE) 48 Cash/Sales 49 (Acct. Rec.)/Sales 50 Inventories/Sales 51 (Net PPE)/Sales 52 (Acct. Pay.)/Sales 53 Accruals/Sales 54 Tax rate 55 Weighted average cost of capital (WACC) 56 10% 20% 75% 2% 5% 25% 10.5% 15% 72% 10% 1% 10% 20% 75% 2% 5% 25% 10.5% 10% 72% 10% 1% 10% 20% 75% 2% 5% 25% 10.5% 6% 72% 10% 1% 10% 20% 75% 2% 5% 25% 10.5% 6% 72% 10% 1% 10% 20% 75% 2% 5% 25% 10.5% 66 na na na 78 79 b. Calculate free cash flow for each projected year. Also calculate the growth rates of free cash flow 80 each year to ensure that there is constant growth (i.e., the same as the constant growth rate in sales) 81 by the end of the forecast period. 82 Actual Projected Projected Projected Projected 83 Calculation of FCF 12/31/2019 12/31/20 12/31/21 12/31/22 12/31/23 84 Operating current assets 85 Operating current liabilities 86 Net operating working capital 87 Net PPE 88 Total net operating capital 89 NOPAT 90 Investment in total net operating capital 91 Free cash flow 22.65 64.51 104.82 111.11 92 Growth in FCF na 93 Growth in sales 94 95 c. Calculate the return on invested capital (ROIC=NOPAT/Total net operating capital) and the growth 96 rate in free cash flow. What is the ROIC in the last year of the forecast? What is the long-term constant 97 growth rate in free cash flow (gl is the growth rate in FCF in the last forecast period because all ratios 98 are constant)? Do you think that Hensley's value would increase if it could add growth without 99 reducing its ROIC? (Hint: Growth will add value if the ROIC > WACCI[1+WACC]). Do you think that the 100 company will have a value of operations greater than its total net operating capital? (Hint: Is ROIC > 101 WACC/[1+g.]?) 102 103 104 Actual Projected Projected Projected Projected 105 12/31/2019 12/31/20 12/31/21 12/31/22 12/31/23 Return on invested capital 106 (ROIC=NOPAT/[Total net operating 107 Weighted average cost of capital (WACC) 108 WACCI(1+g.) 109 WACCI(1+WACC) 110 111 112 Comment. 113 na na na na na naStep by Step Solution
There are 3 Steps involved in it
Step: 1

Get Instant Access to Expert-Tailored Solutions
See step-by-step solutions with expert insights and AI powered tools for academic success
Step: 2

Step: 3
Ace Your Homework with AI
Get the answers you need in no time with our AI-driven, step-by-step assistance
Get Started
The Ascendancy Of Finance
Authors: Joseph Vogl, Simon Garnett
1st Edition
1509509305, 978-1509509300