

Answered step by step
Verified Expert Solution
Question
1 Approved Answer
please fill in yellow. the first picture is just the information Bentley Corporation's most recent financial statements. Use the following ratios and other selected information
please fill in yellow. the first picture is just the information
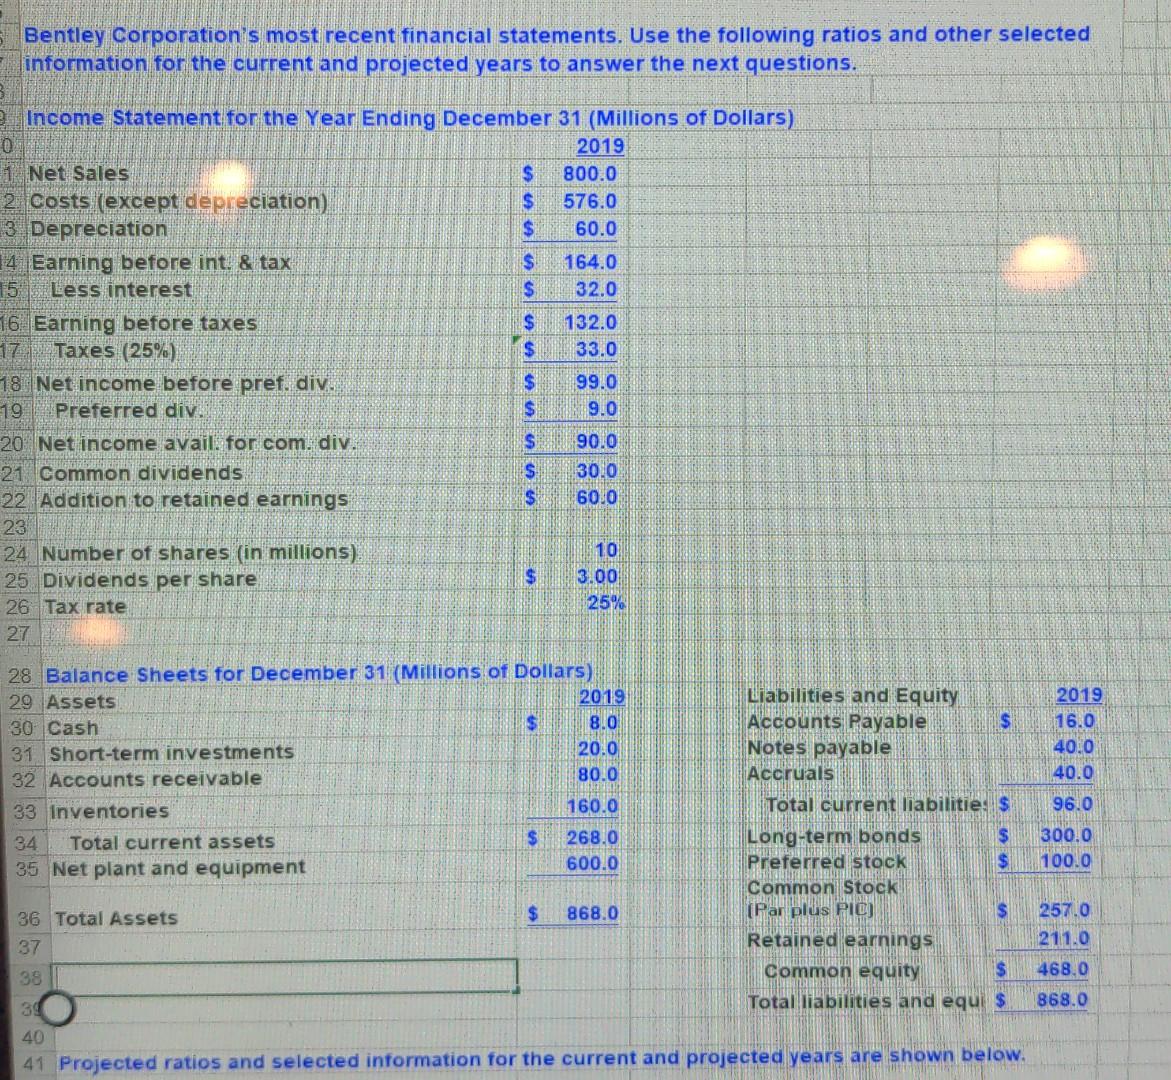
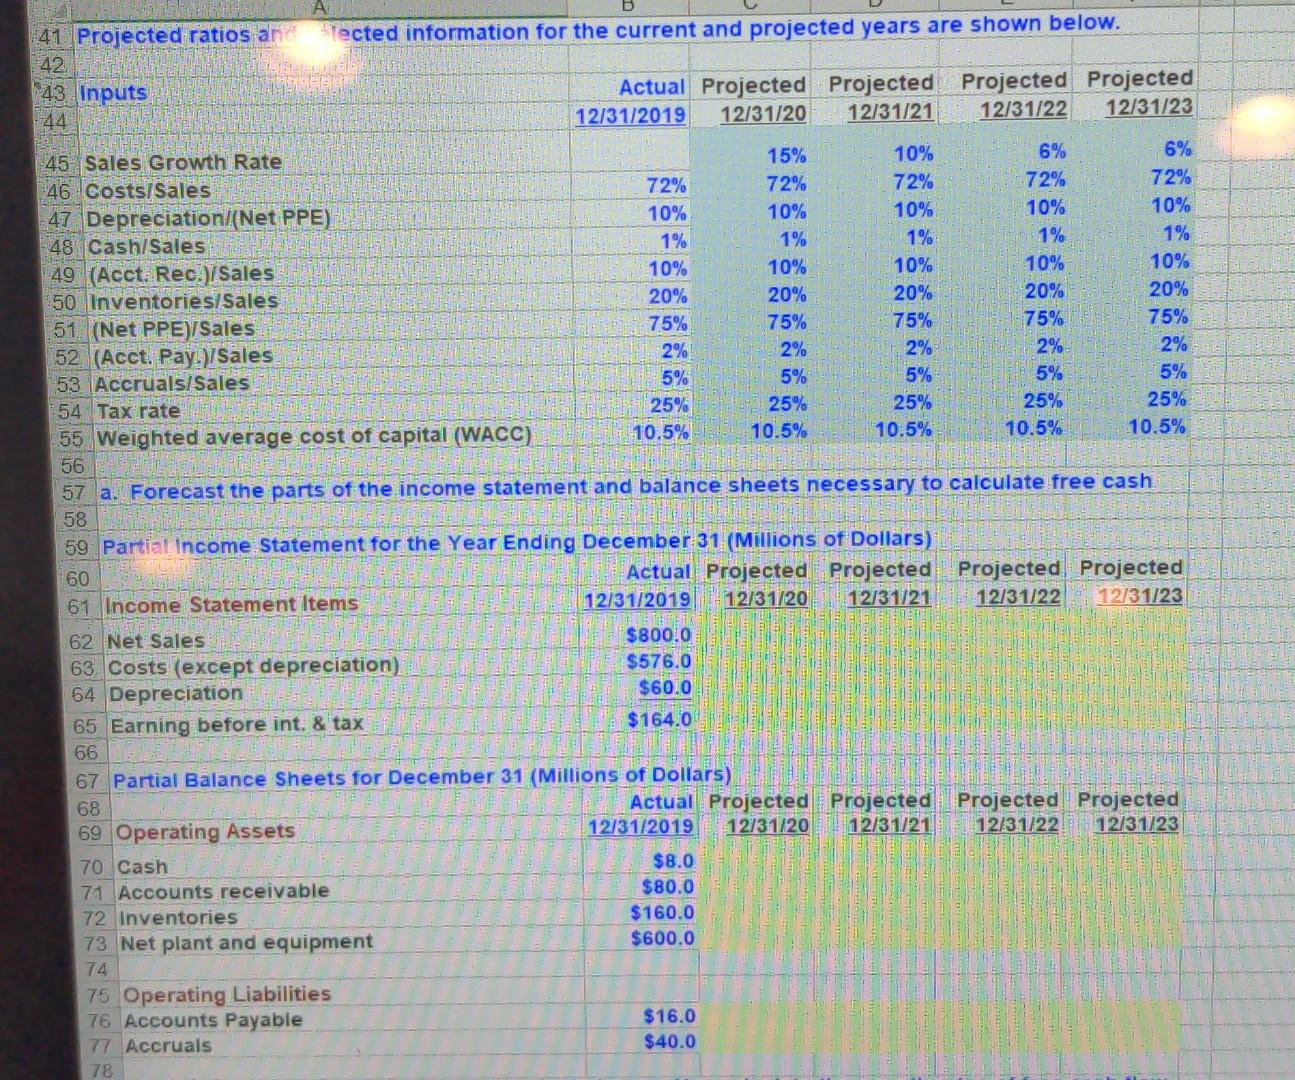
Bentley Corporation's most recent financial statements. Use the following ratios and other selected information for the current and projected years to answer the next questions. Income Statement for the Year Ending December 31 (Millions of Dollars) 0 2019 1 Net Sales $ 800.0 2. costs (except depreciation) $ 576.0 13 Depreciation $ 60.0 4 Earning before int. & tax $ 164.0 15 Less interest $ 32.0 16. Earning before taxes, $ 132.0 17 Taxes (25%) $ 33.0 18 Net income before pref. div. $ 99.0 19 Preferred div. $ 9.0 20 Net income avail. for com. div. $ 90.0 21. Common dividends 30.0 22 Addition to retained earnings $ 6050 23 24 Number of shares (in millions) 10 25 Dividends per share $ 3.00 26 Tax rate 25% 27 nullus 28 Balance Sheets for December 31 (Millions of Dollars) 29 Assets 2019 Liabilities and Equity 2019 30 Cash $ 8.0 Accounts Payable $ 16.0 31 Short-term investments 20.0 Notes payable 40.0 32 Accounts receivable 80.0 Accruals 40.0 33 Inventories 160.0 Total current liabilities 96.0 34 Total current assets $ 268.0 Long-term bonds $ 300.0 35 Net plant and equipment 600.0 Preferred stock $ 100.0 Common Stock 36 Total Assets $ 868.0 (Par plus PIC) $ 257.0 37 Retained earnings 211.0 38 Common equity $ 468.0 30 Total liabilities and equ$ 868.0 40 41 Projected ratios and selected information for the current and projected years are shown below. 5% 41 Projected ratios and Tected information for the current and projected years are shown below. 42 43. Inputs Actual Projected Projected Projected Projected 44 12/31/2019 12/31/20 12/31/21 12/31/22 12/31/23 45- Sales Growth Rate 15% 10% 6% 6% 46 Costs Sales 72% 72% 72% 72% 72% 10% 47 Depreciation (Net PPE) 10% 10% 10% 10% 48 Cash/Sales 1% 1% 1% 1% 1% 49 (Acct: Rec. /Sales 10% 10% 10% 10% 10% 50 Inventories/Sales 20% 20% 20% 20% 20% 51 (Net PPE/Sales 75% 75% 75% 75% 75% 52 (Acct. Pay)/Sales 2% 2% 2% 2% 2% 53 Accruals/Sales 5% 5% 5% 5% 54 Tax rate 25% 25% 25% 25% 25% 55 Weighted average cost of capital (WACC) 10.5% 10.5% 10.5% 10.5% 10.5% 56 57 a. Forecast the parts of the income statement and balance sheets necessary to calculate free cash 58 59 Partial Income Statement for the Year Ending December 31 (Millions of Dollars) 60 Actual Projected Projected Projected Projected 61 Income Statement Items 12/31/2019 12/31/20 12/31/21 12/31/22 12/31/23 62 Net Sales $800.0 63 Costs (except depreciation) $576.0 64 Depreciation $60.0 65 Earning before int. & tax $164.0 66 67 Partial Balance Sheets for December 31 (Millions of Dollars) 68 Actual Projected Projected Projected Projected 69 Operating Assets 12/31/2019 12/31/20 12/31/21 12/31/22 12/31/23 70 Cash 71 Accounts receivable $80.0 72 Inventories $160.0 73 Net plant and equipment $600.0 74 75 Operating Liabilities 76 Accounts Payable $16.0 77 Accruals $40.0 78 $8.0
Step by Step Solution
There are 3 Steps involved in it
Step: 1

Get Instant Access to Expert-Tailored Solutions
See step-by-step solutions with expert insights and AI powered tools for academic success
Step: 2

Step: 3
Ace Your Homework with AI
Get the answers you need in no time with our AI-driven, step-by-step assistance
Get Started
The Oxford Handbook Of State Capitalism And The Firm
Authors: Mike Wright, Geoffrey T. Wood, Alvaro Cuervo-Cazurra, Pei Sun, Ilya Okhmatovskiy, Anna Grosman
1st Edition
0198837364, 978-0198837367