

Answered step by step
Verified Expert Solution
Question
1 Approved Answer
Please fill out the chart neatly. Will rate. Annual and Average Returns for Stocks, Bonds, and T-Bills, 1950 to 2017 You have a portfolio with
Please fill out the chart neatly. Will rate. 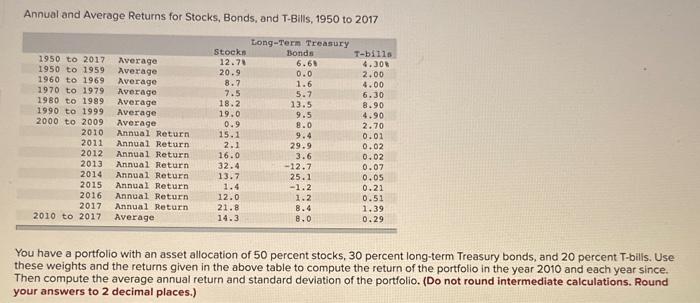
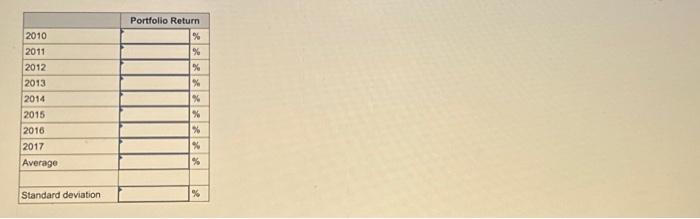
Annual and Average Returns for Stocks, Bonds, and T-Bills, 1950 to 2017 You have a portfolio with an asset allocation of 50 percent stocks, 30 percent long-term Treasury bonds, and 20 percent T-bilis. Use these weights and the returns given in the above table to compute the return of the portfolio in the year 2010 and each year since. Then compute the average annual return and standard deviation of the portfolio. (Do not round intermediate calculations. Round your answers to 2 decimal places.) \begin{tabular}{|l|l|l|} \hline & Portfolio Return \\ \hline 2010 & & % \\ \hline 2011 & & % \\ \hline 2012 & & % \\ \hline 2013 & & % \\ \hline 2014 & & % \\ \hline 2015 & & % \\ \hline 2016 & & % \\ \hline 2017 & & % \\ \hline Average & & % \\ \hline & & \\ \hline & & % \\ \hline \end{tabular} Step by Step Solution
There are 3 Steps involved in it
Step: 1

Get Instant Access to Expert-Tailored Solutions
See step-by-step solutions with expert insights and AI powered tools for academic success
Step: 2

Step: 3
Ace Your Homework with AI
Get the answers you need in no time with our AI-driven, step-by-step assistance
Get Started
Empirical Techniques In Finance
Authors: Ramaprasad Bhar, Shigeyuki Hamori
1st Edition
3642064175, 978-3642064173