

Answered step by step
Verified Expert Solution
Question
1 Approved Answer
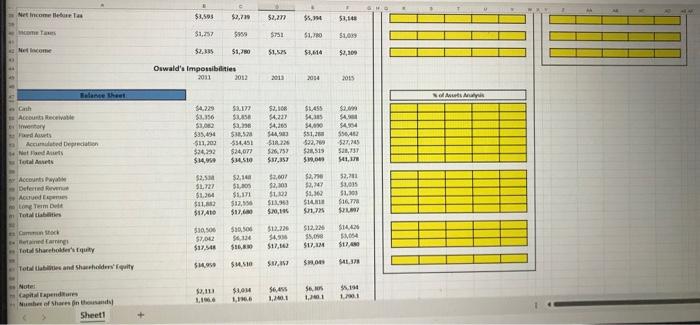
Please fill the spreadsheet. Its a Lab - Ratio analysis base spredsheet. It is due today. any help will be greatly appreciated. 69 Note: A
Please fill the spreadsheet. Its a Lab - Ratio analysis base spredsheet. It is due today. any help will be greatly appreciated. 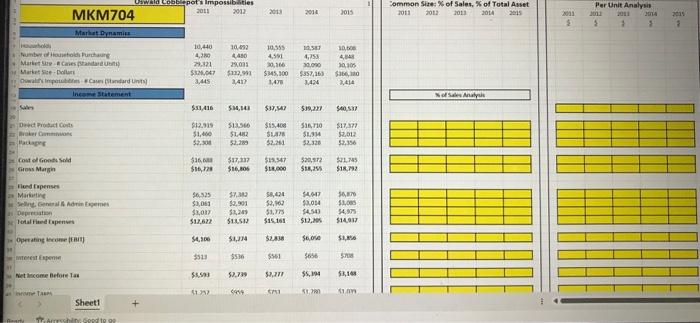
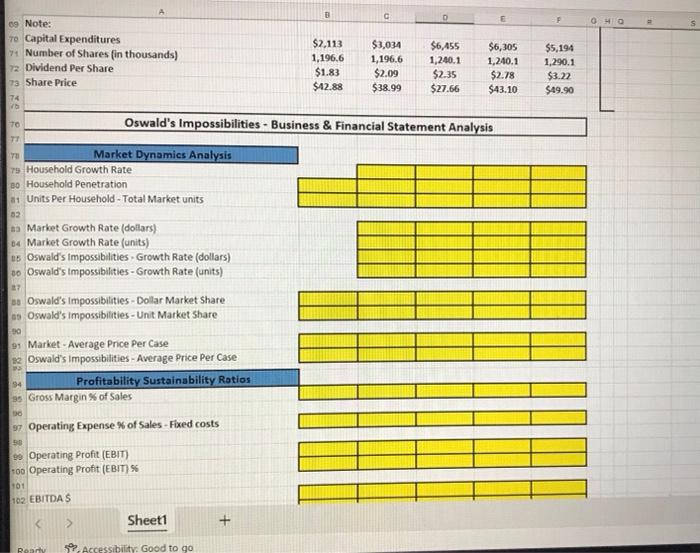
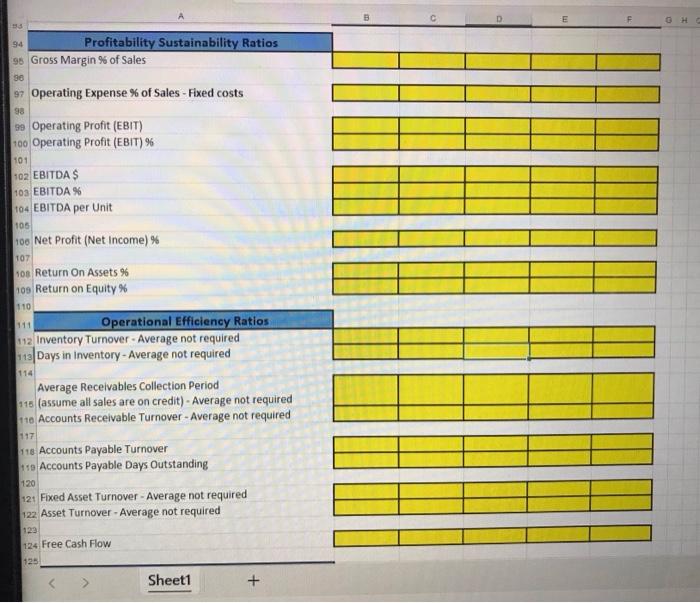
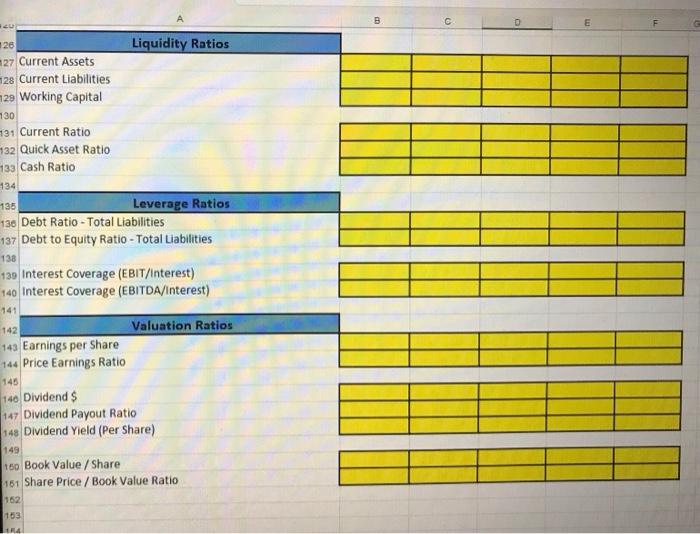
69 Note: A Capital Expenditures Number of Shares fin thousands) Dividend Per Share Share Price \begin{tabular}{|l|c|ccc|} $2.113 & $3,034 & $6,455 & $6,305 & $5,194 \\ 1,196.6 & 1,196.6 & 1,240.1 & 1,240.1 & 1,290.1 \\ $1.83 & $2.09 & $2.35 & $2.78 & $3.22 \\ $42.88 & $38.99 & $27.66 & $43.10 & $49.90 \\ \hline \end{tabular} O. 40= 5 Oswald's Impossibilities - Business \& Financial Statement Analysis Market Dynamies Analysis 75 Household Growth Rate Bo Household Penetration as Units Per Household - Total Market units 02 na Market Growth Rate (dollars) os Market Growth Rate (units) is Oswald's Impossibilities - Growth Rate (dollars) 00 Oswald's Impossibulities - Growth Rate (units) 27 os Oswald's Impossibilities - Dollar Market share as Oswald's impossibilities - Unit Market Share \begin{tabular}{|l|l|l|l|l|} \cline { 2 - 5 } \multicolumn{1}{c|}{} & & & & \\ \hline & & & & \\ \hline & & & & \\ \hline \end{tabular} 90 91 Market - Average Price Per Case Oswald's Impossibilities - Average Price Per Case \begin{tabular}{|l|l|l|l|} \hline & & & \\ \hline & & & \\ \hline & & & \\ \hline & & & \\ \hline \end{tabular} Profitability Sustainability Rotios Gross Margin % of Sales \begin{tabular}{|l|l|l|l|l|} \hline & & & & \\ \hline & & & & \\ \hline \end{tabular} 97 Operating Expense % of Sales - Fixed costs 90 Operating Profit (EBIT) soo Operating Profit (EBIT) % 101 102 EBITDAS \begin{tabular}{|l|l|l|l|l|} \hline & & & & \\ \hline & & & & \\ \hline \end{tabular} Sheet1 Profitability Sustainability Ratios c D. E F Operating Expense % of Sales - Fixed costs Operating Profit (EBIT) Operating Profit (EBIT) \% \begin{tabular}{|l|l|l|l|l|} \hline & & & & \\ \hline & & & & \\ \hline \end{tabular} EBITDA \$ EBITDA \% EBITDA per Unit \begin{tabular}{|l|l|l|l|l|} \hline & & & & \\ \hline & & & & \\ \hline \end{tabular} Net Profit (Net Income) \% Return On Assets \% Return on Equity % 1110 Operational Efficiency Ratios 112 Inventory Turnover - Average not required Days in Inventory-Average not required \begin{tabular}{|l|l|l|l|l|} \hline & & & & \\ \hline & & & & \\ \hline \end{tabular} Average Receivables Collection Period (assume all sales are on credit) - Average not required Accounts Receivable Turnover - Average not required \begin{tabular}{|l|l|l|l|l|} \hline & & & & \\ \hline & & & & \\ \hline \end{tabular} Accounts Payable Turnover Accounts Payable Days Outstanding \begin{tabular}{|l|l|l|l|l|} \hline & & & & \\ \hline & & & & \\ \hline \end{tabular} Fixed Asset Turnover - Average not required Asset Turnover-Average not required \begin{tabular}{|l|l|l|l|l|} \hline & & & & \\ \hline & & & & \\ \hline \end{tabular} Free Cash Flow A B \begin{tabular}{|l|l|l|l|l|} \hline & & & & \\ \hline & & & & \\ \hline & & & & \\ \hline \end{tabular} Current Ratio Quick Asset Ratio Cash Ratio \begin{tabular}{|l|l|l|l|l|} \hline & & & & \\ \hline & & & & \\ \hline & & & & \\ \hline \end{tabular} 5 Leverage Ratios Debt Ratio - Total Liabilities Debt to Equity Ratio - Total Liabilities \begin{tabular}{|l|l|l|l|l|} \hline & & & & \\ \hline & & & & \\ \hline \end{tabular} Interest Coverage (EBIT/Interest) interest Coverage (EBITDA/Interest) \begin{tabular}{|l|l|l|l|l|} \hline & & & & \\ \hline & & & & \\ \hline \end{tabular} Dividend \$ Dividend Payout Ratio Dividend Yield (Per Share) \begin{tabular}{|l|l|l|l|l|} \hline & & & & \\ \hline & & & & \\ \hline & & & & \\ \hline \end{tabular} Book Value / Share Share Price / Book Value Ratio \begin{tabular}{|l|l|l|l|l|} \hline & & & & \\ \hline & & & & \\ \hline \end{tabular} 69 Note: A Capital Expenditures Number of Shares fin thousands) Dividend Per Share Share Price \begin{tabular}{|l|c|ccc|} $2.113 & $3,034 & $6,455 & $6,305 & $5,194 \\ 1,196.6 & 1,196.6 & 1,240.1 & 1,240.1 & 1,290.1 \\ $1.83 & $2.09 & $2.35 & $2.78 & $3.22 \\ $42.88 & $38.99 & $27.66 & $43.10 & $49.90 \\ \hline \end{tabular} O. 40= 5 Oswald's Impossibilities - Business \& Financial Statement Analysis Market Dynamies Analysis 75 Household Growth Rate Bo Household Penetration as Units Per Household - Total Market units 02 na Market Growth Rate (dollars) os Market Growth Rate (units) is Oswald's Impossibilities - Growth Rate (dollars) 00 Oswald's Impossibulities - Growth Rate (units) 27 os Oswald's Impossibilities - Dollar Market share as Oswald's impossibilities - Unit Market Share \begin{tabular}{|l|l|l|l|l|} \cline { 2 - 5 } \multicolumn{1}{c|}{} & & & & \\ \hline & & & & \\ \hline & & & & \\ \hline \end{tabular} 90 91 Market - Average Price Per Case Oswald's Impossibilities - Average Price Per Case \begin{tabular}{|l|l|l|l|} \hline & & & \\ \hline & & & \\ \hline & & & \\ \hline & & & \\ \hline \end{tabular} Profitability Sustainability Rotios Gross Margin % of Sales \begin{tabular}{|l|l|l|l|l|} \hline & & & & \\ \hline & & & & \\ \hline \end{tabular} 97 Operating Expense % of Sales - Fixed costs 90 Operating Profit (EBIT) soo Operating Profit (EBIT) % 101 102 EBITDAS \begin{tabular}{|l|l|l|l|l|} \hline & & & & \\ \hline & & & & \\ \hline \end{tabular} Sheet1 Profitability Sustainability Ratios c D. E F Operating Expense % of Sales - Fixed costs Operating Profit (EBIT) Operating Profit (EBIT) \% \begin{tabular}{|l|l|l|l|l|} \hline & & & & \\ \hline & & & & \\ \hline \end{tabular} EBITDA \$ EBITDA \% EBITDA per Unit \begin{tabular}{|l|l|l|l|l|} \hline & & & & \\ \hline & & & & \\ \hline \end{tabular} Net Profit (Net Income) \% Return On Assets \% Return on Equity % 1110 Operational Efficiency Ratios 112 Inventory Turnover - Average not required Days in Inventory-Average not required \begin{tabular}{|l|l|l|l|l|} \hline & & & & \\ \hline & & & & \\ \hline \end{tabular} Average Receivables Collection Period (assume all sales are on credit) - Average not required Accounts Receivable Turnover - Average not required \begin{tabular}{|l|l|l|l|l|} \hline & & & & \\ \hline & & & & \\ \hline \end{tabular} Accounts Payable Turnover Accounts Payable Days Outstanding \begin{tabular}{|l|l|l|l|l|} \hline & & & & \\ \hline & & & & \\ \hline \end{tabular} Fixed Asset Turnover - Average not required Asset Turnover-Average not required \begin{tabular}{|l|l|l|l|l|} \hline & & & & \\ \hline & & & & \\ \hline \end{tabular} Free Cash Flow A B \begin{tabular}{|l|l|l|l|l|} \hline & & & & \\ \hline & & & & \\ \hline & & & & \\ \hline \end{tabular} Current Ratio Quick Asset Ratio Cash Ratio \begin{tabular}{|l|l|l|l|l|} \hline & & & & \\ \hline & & & & \\ \hline & & & & \\ \hline \end{tabular} 5 Leverage Ratios Debt Ratio - Total Liabilities Debt to Equity Ratio - Total Liabilities \begin{tabular}{|l|l|l|l|l|} \hline & & & & \\ \hline & & & & \\ \hline \end{tabular} Interest Coverage (EBIT/Interest) interest Coverage (EBITDA/Interest) \begin{tabular}{|l|l|l|l|l|} \hline & & & & \\ \hline & & & & \\ \hline \end{tabular} Dividend \$ Dividend Payout Ratio Dividend Yield (Per Share) \begin{tabular}{|l|l|l|l|l|} \hline & & & & \\ \hline & & & & \\ \hline & & & & \\ \hline \end{tabular} Book Value / Share Share Price / Book Value Ratio \begin{tabular}{|l|l|l|l|l|} \hline & & & & \\ \hline & & & & \\ \hline \end{tabular} Step by Step Solution
There are 3 Steps involved in it
Step: 1

Get Instant Access to Expert-Tailored Solutions
See step-by-step solutions with expert insights and AI powered tools for academic success
Step: 2

Step: 3
Ace Your Homework with AI
Get the answers you need in no time with our AI-driven, step-by-step assistance
Get Started
Audit Customer Satisfaction Marketing Added Value
Authors: Cindy E. Cosmas
1st Edition
089413373X, 978-0894133732