Please Fill this blanks
** References


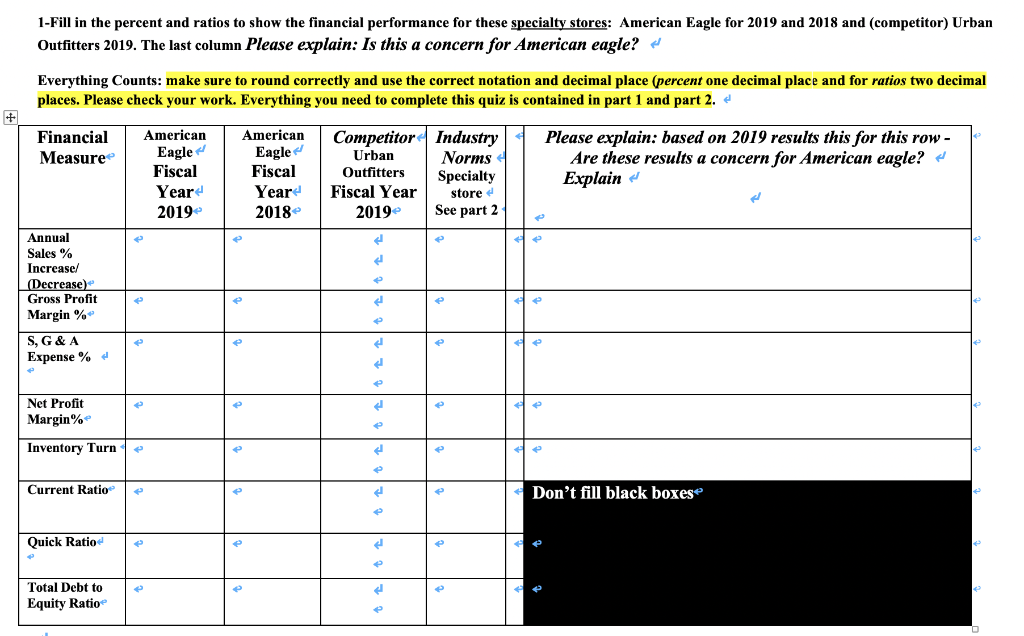
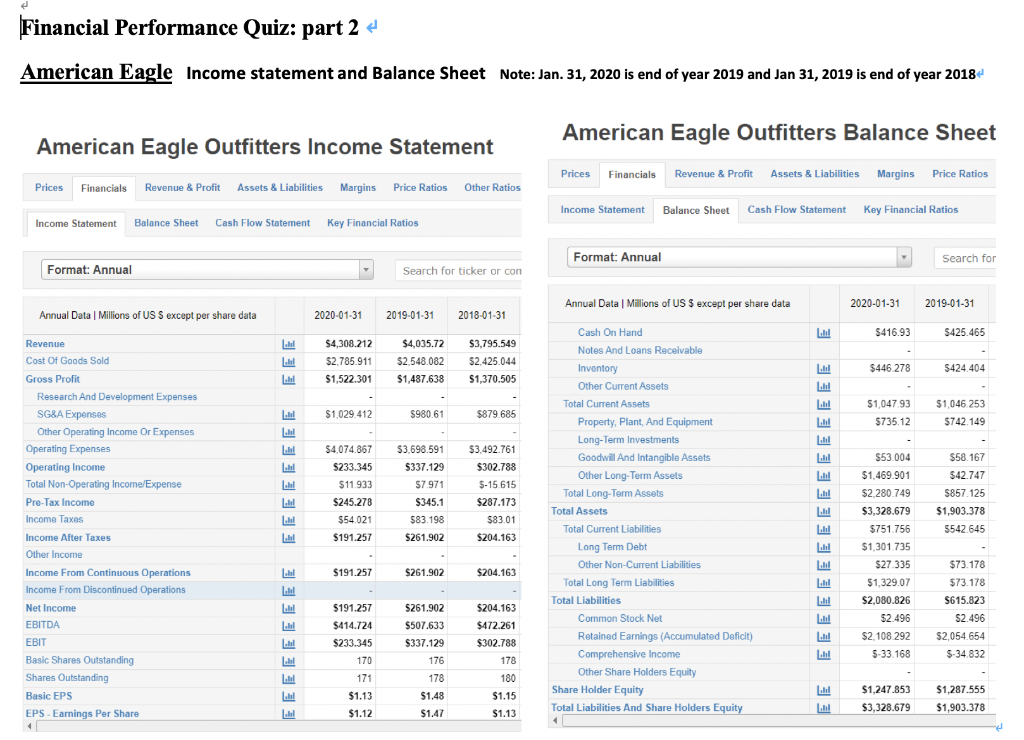
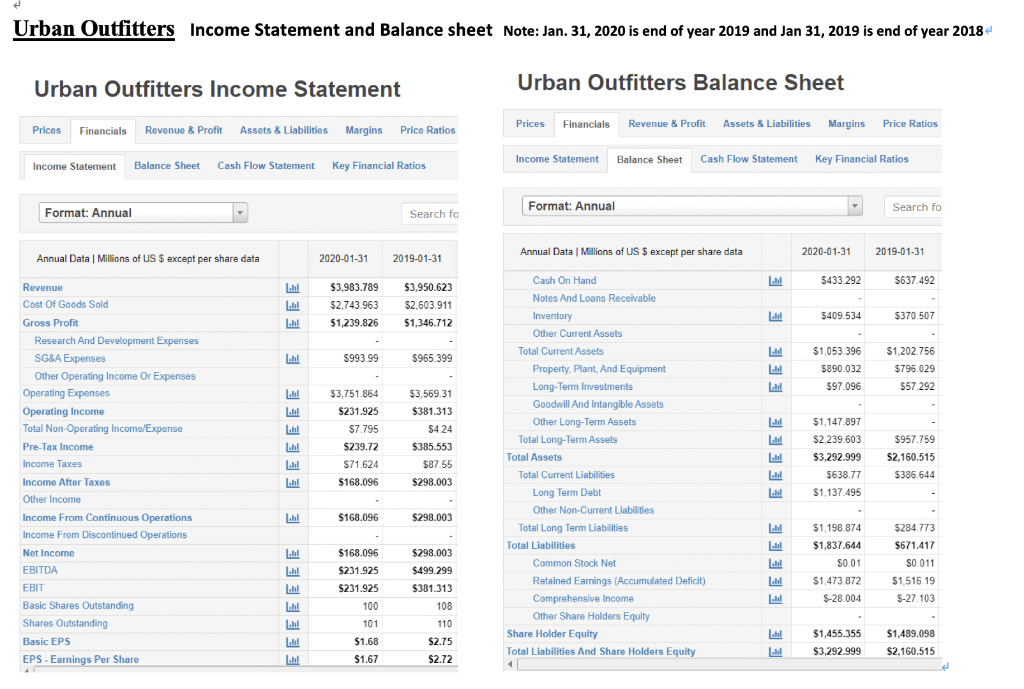
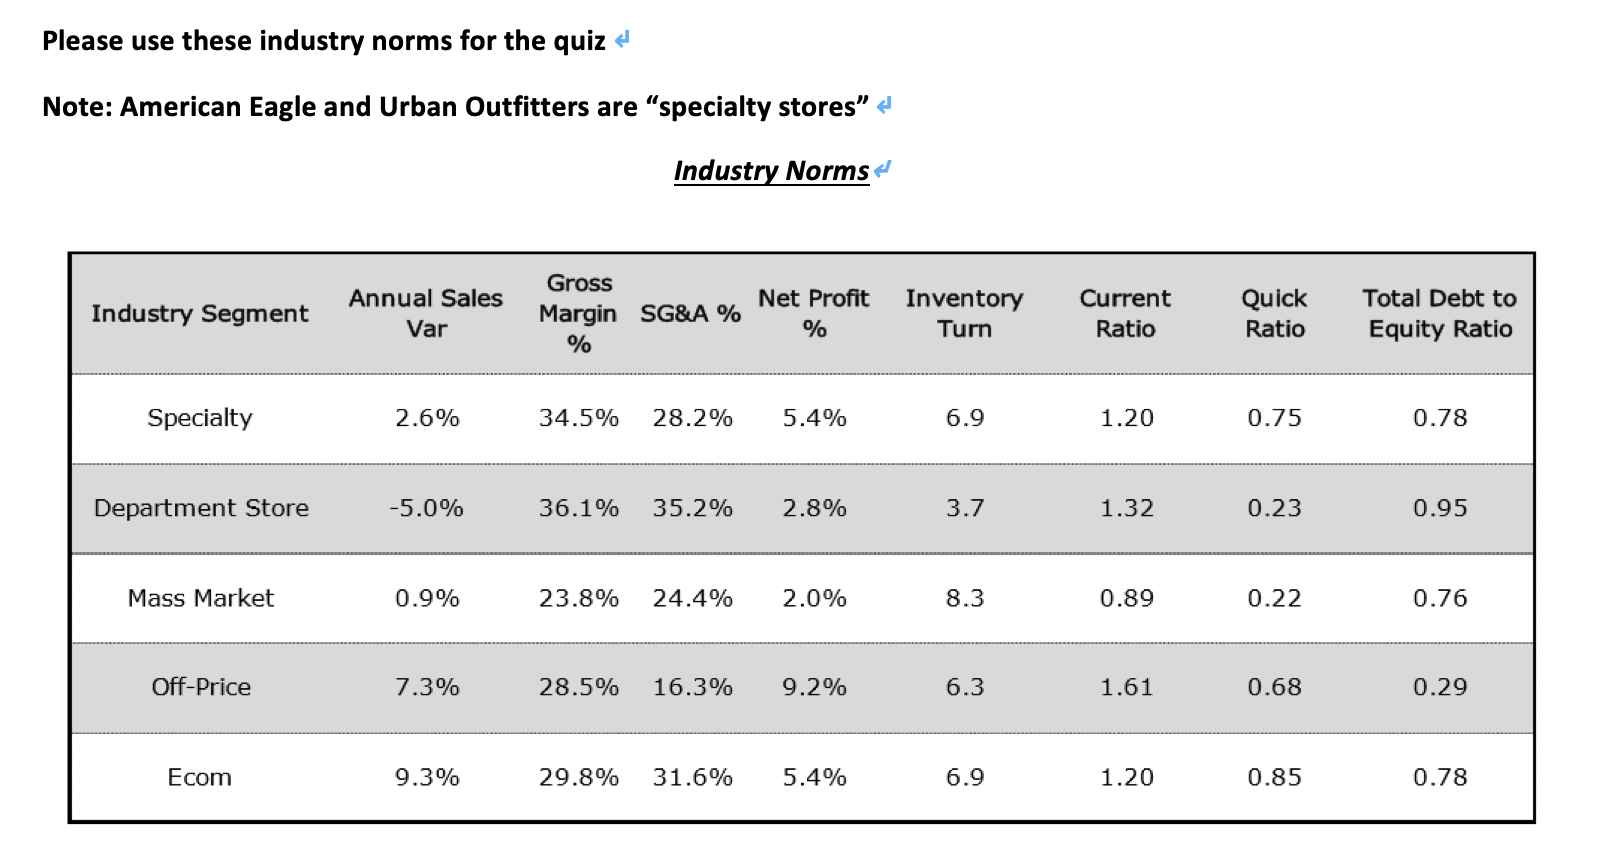
1- Fill in the percent and ratios to show the financial performance for these specialty stores: American Eagle for 2019 and 2018 and (competitor) Urban Outfitters 2019. The last column Please explain: Is this a concern for American eagle? Everything Counts: make sure to round correctly and use the correct notation and decimal place (percent one decimal place and for ratios two decimal places. Please check your work. Everything you need to complete this quiz is contained in part 1 and part 2. Financial Measure American Eagle Fiscal Yeard 2019 American Eagle Fiscal Year 2018 Competitor Industry Urban Norms Outfitters Specialty Fiscal Year store e 2019 See part 2 Please explain: based on 2019 results this for this row - Are these results a concern for American eagle? Explain e el Annual Sales % Increased (Decrease Gross Profit Margin % S, G&A Expense % e e e Net Profit Margin% Inventory Turn e e Current Ratio Don't fill black boxes e Quick Ratio Total Debt to Equity Ratio e Financial Performance Quiz: part 2 - American Eagle Income statement and Balance Sheet Note: Jan. 31, 2020 is end of year 2019 and Jan 31, 2019 is end of year 2018- American Eagle Outfitters Balance Sheet American Eagle Outfitters Income Statement Prices Financial Revenue & Profit Assets & Liabilities Margins Price Ratios Prices Financials Revenue & Profit Assets & Liabilities Margins Margins Price Ratios Price Ratios Other Ratios Income Statement Balance Sheet Cash Flow Statement Key Financial Ratios Income Statement Balance Sheet Cash Flow Statement Key Financial Ratios Format: Annual Search for Format: Annual Search for ticker or con Annual Data Millions of US $ except per share data 2020-01-31 2019-01-31 Annual Data Millions of US S except per share data 2020-01-31 2019-01-31 2018-01-31 $416.93 $425.465 $4,308.212 52.785.911 $1,522.301 $4,035.72 $2.548.082 $1,487.638 $3,795,549 52.425.044 $1,370.505 [lil $446 278 $424.404 $1,047 93 $1,029.412 $980.61 $879 685 $1,046 253 $742.149 $735.12 $3.492.761 $302.788 Revenue Cost Of Goods Sold Gross Profit Research And Development Expenses SG&A Expenses Other Operating Income Or Expenses Operating Expenses Operating Income Total Non-Operating Income/Expense Pre-Tax Income Income Taxes Income After Taxes Other Income Income From Continuous Operations Income From Discontinued Operations Net Income EBITDA EBIT Basic Shares Outstanding Shares Outstanding Basic EPS EPS Earnings Per Share $4.074.867 $233.345 $11.933 $245.278 $ $54021 $191.257 $3.698.591 $337.129 57.971 $345.1 $83.198 $261.902 lil | lil LUI! E E E EE EEEEEEEEEEEEEEE $53.004 $1,469.901 $2.280.749 $3,328.679 5-15.615 $287.173 $83.01 $ $204.163 Cash On Hand Notes And Loans Receivable Inventory Other Current Assets Total Current Assets Property, Plant, And Equipment Long-Term Investments Goodwill And Intangible Assets Other Long-Term Assets Total Long-Term Assets Total Assets Total Current Liabilities Long Term Debt Other Non-Current Liabilities Total Long Term Liabilities Total Liabilities Common Stock Net Retained Earnings (Accumulated Deficit) Comprehensive Income Other Share Holders Equity Share Holder Equity Total Liabilities And Share Holders Equity $58.167 $42.747 5857 125 $1,903.378 5542.645 $191.257 $261.902 $204.163 lil lil $751.756 $1,301 735 $27.335 $1,329.07 $2,080.826 $2.496 $2,108 292 5-33.168 $261.902 $191.257 $414.724 $233.345 170 171 $1.13 $1.12 $73.178 $73.178 $615.823 $2.496 $2,054.654 $-34 832 $204.163 $472.261 $302.788 178 $507.633 $337.129 176 LI lil Ill 178 $1.48 $1.47 180 $1.15 $1.13 $1,247.853 $3,328.679 $1,287.555 $1,903.378 [lil Urban Outfitters Income Statement and Balance sheet Note: Jan. 31, 2020 is end of year 2019 and Jan 31, 2019 is end of year 2018 Urban Outfitters Income Statement Urban Outfitters Balance Sheet Prices Financials Revenue & Profit Assets & Liabilities Margins Price Ratios Prices Financials Revenue & Profit Assets & Liabilities Margins Price Ratios Income Statement Balance Sheet Cash Flow Statement Key Financial Ratios Income Statement Balance Sheet Cash Flow Statement Key Financial Ratios Format: Annual Search fo Format: Annual Search fo Annual Data Millions of US $ except per share data 2020-01-31 2019-01-31 Annual Data | Millions of US $ except per share data 2020-01-31 2019-01-31 $433292 $637.492 $ $3,983.789 $2,743.963 $1,239.826 Cash On Hand Notes And Loans Receivable $3,950.623 $2.603.911 $1,346.712 E E Inventory $409.534 $370.507 $993.99 $965.399 $1,053.396 5890.032 $97.096 EEEEEEEEEE $1,202.756 $796.029 $57.292 $ Revenue Cost Of Goods Sold Gross Profit Research And Development Expenses SG&A Expenses Other Operating Income Or Expenses Operating Expenses Operating Income Total Non-Operating Income/Expense Pre-Tax Income Income Taxes Income After Taxes Other Income Income From Continuous Operations Income From Discontinued Operations Net Income EBITDA EBIT Basic Shares Outstanding Shares Outstanding Basic EPS EPS - Earnings Per Share $3,751.864 $231.925 $7.795 $239.72 $71.624 $3,569.31 $381.313 $4.24 $385.553 $87.55 $298.003 EEEEEEEEEEEEE Other Current Assets Total Current Assets Property, Plant, And Equipment Long-Term Investments Goodwill And Intangible Assets Other Long-Term Assets Total Long-Term Assets Total Assets Total Current Liabilities Long Term Debt Other Non-Current Liabilities Total Long Term Liabilities Total Liabilities Common Stock Net Retained Earnings (Accumulated Deficit) Comprehensive Income Other Share Holders Equity Share Holder Equity Total Liabilities And Share Holders Equity $1,147.897 $2.239.603 $3,292.999 $638.77 $1,137.495 $957.759 $2,160.515 $386.644 $168.096 - $168.096 $298.003 EEEEEEEE $168.096 $231.925 $231.925 100 $298.003 $ $499.299 $ $381.313 108 $1,198,874 $1,837.644 30.01 $1,473 872 $-28004 $284 773 $671.417 $0.011 $1,516.19 $-27.103 110 101 $1.68 $2.75 $2.72 EE $1,455.355 $3,292.999 $1,489.098 $2,160.515 $1.67 Please use these industry norms for the quiz Note: American Eagle and Urban Outfitters are "specialty stores + Industry Norms Industry Segment Annual Sales Var Gross Margin SG&A % % Net Profit % Inventory Turn Current Ratio Quick Ratio Total Debt to Equity Ratio Specialty 2.6% 34.5% 28.2% 5.4% 6.9 1.20 0.75 0.78 Department Store -5.0% 36.1% 35.2% 2.8% 3.7 1.32 0.23 0.95 Mass Market 0.9% 23.8% 24.4% 2.0% 8.3 0.89 0.22 0.76 Off-Price 7.3% 28.5% 16.3% 9.2% 6.3 1.61 0.68 0.29 Ecom 9.3% 29.8% 31.6% 5.4% 6.9 1.20 0.85 0.78 1- Fill in the percent and ratios to show the financial performance for these specialty stores: American Eagle for 2019 and 2018 and (competitor) Urban Outfitters 2019. The last column Please explain: Is this a concern for American eagle? Everything Counts: make sure to round correctly and use the correct notation and decimal place (percent one decimal place and for ratios two decimal places. Please check your work. Everything you need to complete this quiz is contained in part 1 and part 2. Financial Measure American Eagle Fiscal Yeard 2019 American Eagle Fiscal Year 2018 Competitor Industry Urban Norms Outfitters Specialty Fiscal Year store e 2019 See part 2 Please explain: based on 2019 results this for this row - Are these results a concern for American eagle? Explain e el Annual Sales % Increased (Decrease Gross Profit Margin % S, G&A Expense % e e e Net Profit Margin% Inventory Turn e e Current Ratio Don't fill black boxes e Quick Ratio Total Debt to Equity Ratio e Financial Performance Quiz: part 2 - American Eagle Income statement and Balance Sheet Note: Jan. 31, 2020 is end of year 2019 and Jan 31, 2019 is end of year 2018- American Eagle Outfitters Balance Sheet American Eagle Outfitters Income Statement Prices Financial Revenue & Profit Assets & Liabilities Margins Price Ratios Prices Financials Revenue & Profit Assets & Liabilities Margins Margins Price Ratios Price Ratios Other Ratios Income Statement Balance Sheet Cash Flow Statement Key Financial Ratios Income Statement Balance Sheet Cash Flow Statement Key Financial Ratios Format: Annual Search for Format: Annual Search for ticker or con Annual Data Millions of US $ except per share data 2020-01-31 2019-01-31 Annual Data Millions of US S except per share data 2020-01-31 2019-01-31 2018-01-31 $416.93 $425.465 $4,308.212 52.785.911 $1,522.301 $4,035.72 $2.548.082 $1,487.638 $3,795,549 52.425.044 $1,370.505 [lil $446 278 $424.404 $1,047 93 $1,029.412 $980.61 $879 685 $1,046 253 $742.149 $735.12 $3.492.761 $302.788 Revenue Cost Of Goods Sold Gross Profit Research And Development Expenses SG&A Expenses Other Operating Income Or Expenses Operating Expenses Operating Income Total Non-Operating Income/Expense Pre-Tax Income Income Taxes Income After Taxes Other Income Income From Continuous Operations Income From Discontinued Operations Net Income EBITDA EBIT Basic Shares Outstanding Shares Outstanding Basic EPS EPS Earnings Per Share $4.074.867 $233.345 $11.933 $245.278 $ $54021 $191.257 $3.698.591 $337.129 57.971 $345.1 $83.198 $261.902 lil | lil LUI! E E E EE EEEEEEEEEEEEEEE $53.004 $1,469.901 $2.280.749 $3,328.679 5-15.615 $287.173 $83.01 $ $204.163 Cash On Hand Notes And Loans Receivable Inventory Other Current Assets Total Current Assets Property, Plant, And Equipment Long-Term Investments Goodwill And Intangible Assets Other Long-Term Assets Total Long-Term Assets Total Assets Total Current Liabilities Long Term Debt Other Non-Current Liabilities Total Long Term Liabilities Total Liabilities Common Stock Net Retained Earnings (Accumulated Deficit) Comprehensive Income Other Share Holders Equity Share Holder Equity Total Liabilities And Share Holders Equity $58.167 $42.747 5857 125 $1,903.378 5542.645 $191.257 $261.902 $204.163 lil lil $751.756 $1,301 735 $27.335 $1,329.07 $2,080.826 $2.496 $2,108 292 5-33.168 $261.902 $191.257 $414.724 $233.345 170 171 $1.13 $1.12 $73.178 $73.178 $615.823 $2.496 $2,054.654 $-34 832 $204.163 $472.261 $302.788 178 $507.633 $337.129 176 LI lil Ill 178 $1.48 $1.47 180 $1.15 $1.13 $1,247.853 $3,328.679 $1,287.555 $1,903.378 [lil Urban Outfitters Income Statement and Balance sheet Note: Jan. 31, 2020 is end of year 2019 and Jan 31, 2019 is end of year 2018 Urban Outfitters Income Statement Urban Outfitters Balance Sheet Prices Financials Revenue & Profit Assets & Liabilities Margins Price Ratios Prices Financials Revenue & Profit Assets & Liabilities Margins Price Ratios Income Statement Balance Sheet Cash Flow Statement Key Financial Ratios Income Statement Balance Sheet Cash Flow Statement Key Financial Ratios Format: Annual Search fo Format: Annual Search fo Annual Data Millions of US $ except per share data 2020-01-31 2019-01-31 Annual Data | Millions of US $ except per share data 2020-01-31 2019-01-31 $433292 $637.492 $ $3,983.789 $2,743.963 $1,239.826 Cash On Hand Notes And Loans Receivable $3,950.623 $2.603.911 $1,346.712 E E Inventory $409.534 $370.507 $993.99 $965.399 $1,053.396 5890.032 $97.096 EEEEEEEEEE $1,202.756 $796.029 $57.292 $ Revenue Cost Of Goods Sold Gross Profit Research And Development Expenses SG&A Expenses Other Operating Income Or Expenses Operating Expenses Operating Income Total Non-Operating Income/Expense Pre-Tax Income Income Taxes Income After Taxes Other Income Income From Continuous Operations Income From Discontinued Operations Net Income EBITDA EBIT Basic Shares Outstanding Shares Outstanding Basic EPS EPS - Earnings Per Share $3,751.864 $231.925 $7.795 $239.72 $71.624 $3,569.31 $381.313 $4.24 $385.553 $87.55 $298.003 EEEEEEEEEEEEE Other Current Assets Total Current Assets Property, Plant, And Equipment Long-Term Investments Goodwill And Intangible Assets Other Long-Term Assets Total Long-Term Assets Total Assets Total Current Liabilities Long Term Debt Other Non-Current Liabilities Total Long Term Liabilities Total Liabilities Common Stock Net Retained Earnings (Accumulated Deficit) Comprehensive Income Other Share Holders Equity Share Holder Equity Total Liabilities And Share Holders Equity $1,147.897 $2.239.603 $3,292.999 $638.77 $1,137.495 $957.759 $2,160.515 $386.644 $168.096 - $168.096 $298.003 EEEEEEEE $168.096 $231.925 $231.925 100 $298.003 $ $499.299 $ $381.313 108 $1,198,874 $1,837.644 30.01 $1,473 872 $-28004 $284 773 $671.417 $0.011 $1,516.19 $-27.103 110 101 $1.68 $2.75 $2.72 EE $1,455.355 $3,292.999 $1,489.098 $2,160.515 $1.67 Please use these industry norms for the quiz Note: American Eagle and Urban Outfitters are "specialty stores + Industry Norms Industry Segment Annual Sales Var Gross Margin SG&A % % Net Profit % Inventory Turn Current Ratio Quick Ratio Total Debt to Equity Ratio Specialty 2.6% 34.5% 28.2% 5.4% 6.9 1.20 0.75 0.78 Department Store -5.0% 36.1% 35.2% 2.8% 3.7 1.32 0.23 0.95 Mass Market 0.9% 23.8% 24.4% 2.0% 8.3 0.89 0.22 0.76 Off-Price 7.3% 28.5% 16.3% 9.2% 6.3 1.61 0.68 0.29 Ecom 9.3% 29.8% 31.6% 5.4% 6.9 1.20 0.85 0.78


