

Question
please find 1)Current ratio = current assets/current liabilities 2)quick ratio= quick assets(current assets less prepaid expenses and inventories)/current liabilities(all current liabilities less bank overdraft and
please find 1)Current ratio = current assets/current liabilities 2)quick ratio= quick assets(current assets less prepaid expenses and inventories)/current liabilities(all current liabilities less bank overdraft and prepaid income 3) Capital structure Debt equity ratio = long term debts/ shareholders funds Proprietary ratio= Proprietor funds/total funds and assets Debt to total capital ratio=long term debt/share holders fund plus long term debt Interest coverage ratio = ebit(earning before interest in tax /interest Debt service coverage ratio=IIat((income after tax+depreciation+interest+other non cash expenses)/ interest + principle installment 4) Profitability ratios Gross profit margin=(gross profitet sales )*100 Net profit margin= (net profit after tax in interest / net sales )*100 Expense ratio=( all expenses/ net sales )*100
Return on assets= (net profit after taxes plus interest/ total assets )*100 Return on capital employed = net profit after taxes plus interest /capital employed * 100 Return on share holders equity= (net profit after taxes/ total share holders equity )*100 Earnings per share=net profit after tax - preference dividend/ number of equity shares Dividend per share = divided paid to ordinary share holders over number of equity shares Dividend payout ratio= dividend per share / earnings per share *100| Inventory turnover ratio
6 ) activity ratio Inventory turnover ratio=cost of good sold/ average stock(opening stock+closing stock/2) Debtor turnover ratio= credit sales /average debtor and bills receivable Asset turnover ratio Total asset turnover ratio = sales/cost of goods sold Average total assets Fixed asset turnover ratio = sales/cost of goods sold Average fixed assets Capital turnover ratio = sales/cost of goods sold Average capital employed Working capital turnover ratio = sales/cost of goods sold Net working capital
reditors turnover ratio = credit purchases / Average creditors & bills payables
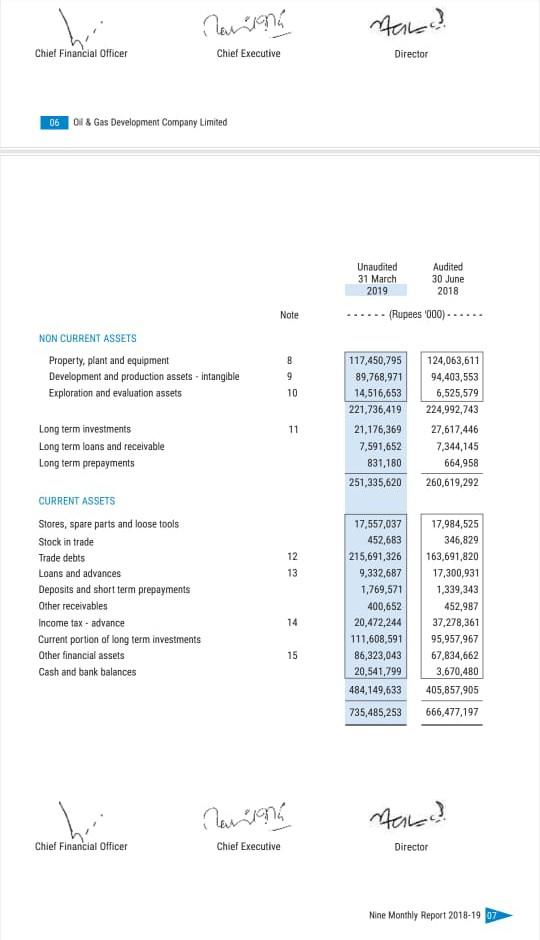
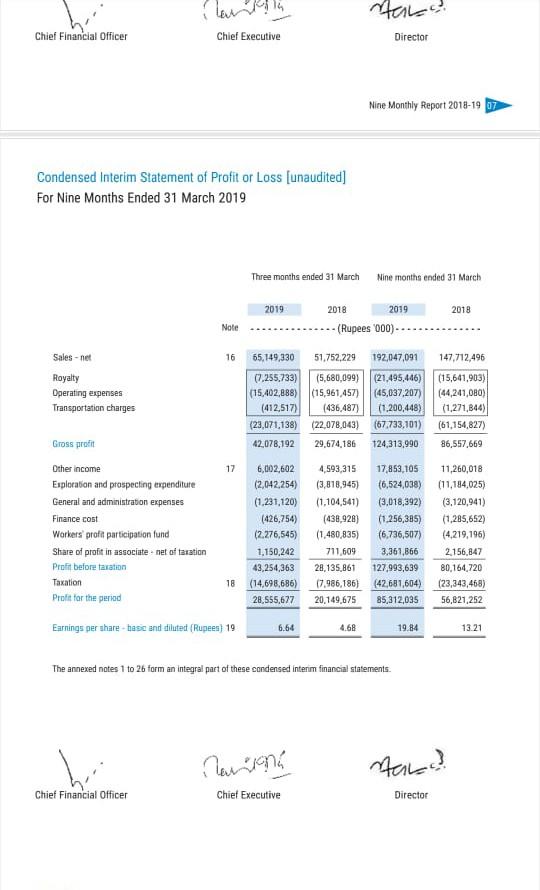
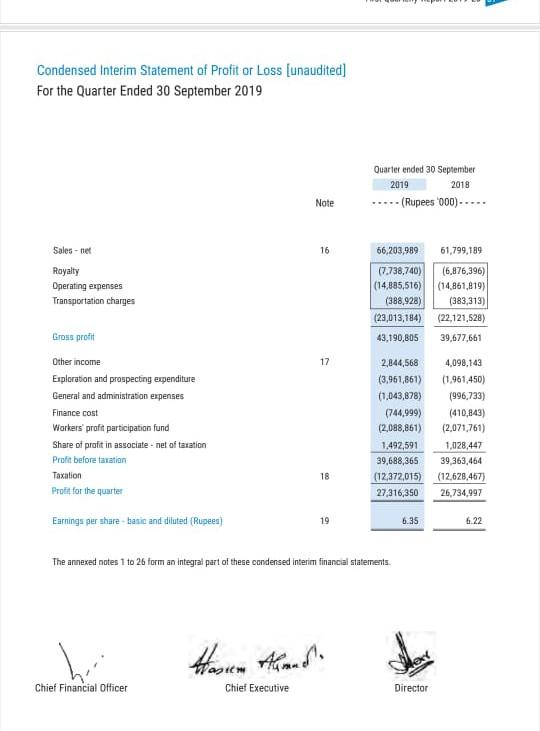
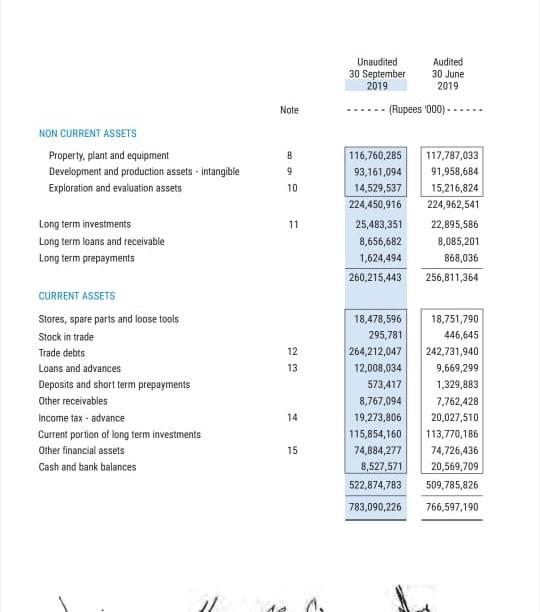
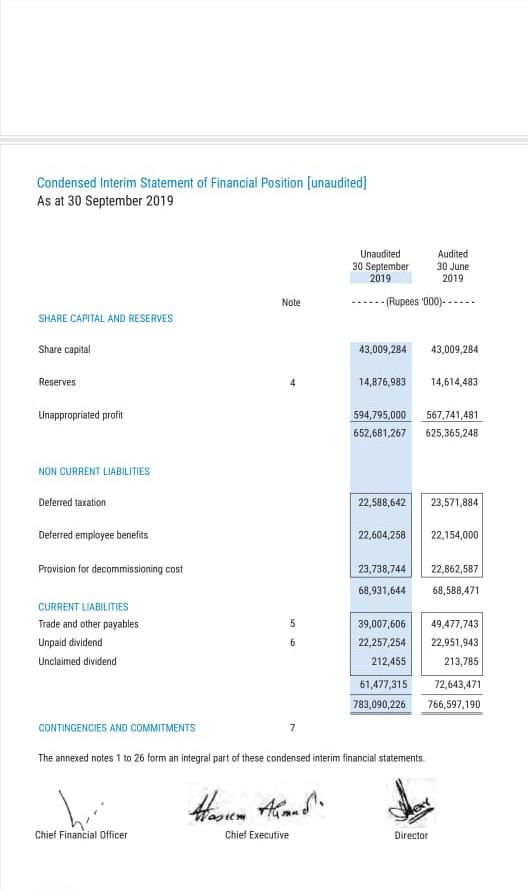
hr lanina tand Chief Financial Officer Chief Executive Director 06 & Gas Development Company Limited Unaudited 31 March 2019 Audited 30 June 2018 Note (Rupees 000) NON CURRENT ASSETS Property, plant and equipment Development and production assets - intangible Exploration and evaluation assets B 9 124,063,611 94,403,553 6,525,579 224,992,743 10 117,450,795 89,768,971 14,516,653 221,736,419 21,176,369 7,591,652 831,180 251,335,620 Long term investments Long term loans and receivable Long term prepayments 11 27,617,446 7,344,145 664,958 260,619,292 12 13 CURRENT ASSETS Stores, spare parts and loose tools Stock in trade Trade debts Loans and advances Deposits and short term prepayments Other receivables Income tax - advance Current portion of long term investments Other financial assets Cash and bank balances 17,557,037 452,683 215,691,326 9,332,687 1,769,571 400,652 20,472,244 111,608,591 86,323,043 20,541,799 484,149,633 735,485,253 17,984,525 346,829 163,691,820 17,300,931 1,339,343 452,987 37,278,361 95,957,967 67,834,662 3,670,480 405,857,905 14 15 666,477,197 lanina hald Chief Financial Officer Chief Executive Director Nine Monthly Report 2018-19 07 Hala Director Chief Financial Officer Chief Executive Nine Monthly Report 2018-1907 Condensed Interim Statement of Profit or Loss unaudited] For Nine Months Ended 31 March 2019 Three months ended 31 March Nine months ended 31 March 2019 2018 2018 2019 (Rupees 000) Note Sales-net 16 65,149,330 51.752,229 192,047,091 147,712,496 Royalty Operating expenses Transportation charges (7,255,733) (15,402,888) (412,517) (23,071,138) 42,078,192 (5,680,099) (15,961,457) (436,487) (22,078,043) 29,674,186 (21,495,446) (45,037,207) (1,200,448) (67.733,101) (15,641,903) (44,241,080) (1,271,844) (61.154,827) 86,557,669 Gross profit 124,313,990 17 Other income Exploration and prospecting expenditute General and administration expenses Finance cost Workers' prata participation fund Share of profit in associate - net of taxation Profit before taxation Taxation Profit for the period 6,002,602 (2,042,254 (1.231,120) (426,754) (2.276,545) 1.150.242 43,254,363 (14,698,686) 28,555,677 4,593,315 (3,818,945) (1.104,541) (438,928) (1.480,835) 711,609 28,135,861 17,986,186) 20.149,675 17,853,105 (6,524,038) (3,018,392) (1.256,385) (6.736,507) 3,361,866 127,993,639 (42,681,604) 85,312,095 11,260,018 (11,194,025) (3,120,941) (1,285,652) (4.219,196) 2.156,847 80,164,720 (23,343,468) 56,821,252 18 Earnings per share-hase and diluted (Rupees) 19 6.64 4.68 19.84 13.21 The annexed notes 1 to 26 form an integral part of these condensed interim financial statements hi nanini tauo Chief Financial Officer Chief Executive Director Condensed Interim Statement of Profit or Loss (unaudited] For the Quarter Ended 30 September 2019 Quarter ended 30 September 2019 2018 -- (Rupees '000)..... Note Sales.net 16 66,203,989 61,799,189 Royalty Operating expenses Transportation charges (7.738,740) (14,885,516) (388,928) (23,013,184) 43,190,805 (6,876,396) (14,861,819) (383,313) (22,121,528) 39,677,661 Gross profit 17 Other income Exploration and prospecting expenditure General and administration expenses Finance cost Workers' profit participation fund Share of profit in associate net of taxation Profit before taxation Taxation Profit for the quarter 2,844,568 (3,961,861) (1.043,678) (744,999) (2,088,861) 1.492,591 39,688,365 (12,372,015) 27,316,350 4,098,143 (1,961,450) (996,733) (410,843) (2,071761) 1,028,447 39,363,464 (12,628,467) 26,734,997 18 Earnings per share-basic and diluted (Rupees) 19 6.35 6.22 The annexed notes 1 to 26 form an integral part of these condensed interim financial statements. hi tasun Chief Financial Officer Chief Executive Director Unaudited Audited 30 September 30 June 2019 2019 (Rupees '000). Note NON CURRENT ASSETS Property, plant and equipment Development and production assets - Intangible Exploration and evaluation assets B 9 10 116.760,285 93,161,094 14,529,537 224,450,916 25,483,351 8,656,682 1,624,494 260,215,443 Long term investments Long term loans and receivable Long term prepayments 117,787,033 91,958,684 15,216,824 224,962,541 22,895,586 8,085,201 368,036 256,811,364 11 12 13 CURRENT ASSETS Stores, spare parts and loose tools Stock in trade Trade debts Loans and advances Deposits and short term prepayments Other receivables Income tax - advance Current portion of long term investments Other financial assets Cash and bank balances 18,478,596 295,781 264,212,047 12,008,034 573,417 8,767,094 19,273,806 115,854,160 74,884,277 8,527,571 522,874,783 783,090,226 18,751,790 446,645 242,731,940 9,669,299 1,329,883 7,762,428 20.027,510 113,770,186 74,726,436 20,569,709 509,785,826 14 15 766,597,190 1 Condensed Interim Statement of Financial Position (unaudited] As at 30 September 2019 Unaudited 30 September 2019 Audited 30 June 2019 Note -- (Rupees '000.- SHARE CAPITAL AND RESERVES Share capital 43,009,284 43,009,284 Reserves 14,876,983 14,614,483 Unappropriated profit 594,795,000 652,681,267 567,741,481 625,365,248 NON CURRENT LIABILITIES Deferred taxation 22,588,642 23,571,884 Deferred employee benefits 22,604,258 22,154,000 Provision for decommissioning cost 23,738,744 22,862,587 68,931,644 68,588,471 CURRENT LIABILITIES Trade and other payables Unpaid dividend Unclaimed dividend chun 39,007,606 22,257,254 212,455 49,477,743 22,951,943 213,785 72,643,471 61,477,315 783,090,226 766,597,190 CONTINGENCIES AND COMMITMENTS 7 The annexed notes 1 to 26 form an integral part of these condensed interim financial statements. Chief Financial Officer Chief Executive DirectorStep by Step Solution
There are 3 Steps involved in it
Step: 1

Get Instant Access to Expert-Tailored Solutions
See step-by-step solutions with expert insights and AI powered tools for academic success
Step: 2

Step: 3
Ace Your Homework with AI
Get the answers you need in no time with our AI-driven, step-by-step assistance
Get Started
Financial Accounting
Authors: Pauline Weetman
8th Edition
129224447X, 9781292244471