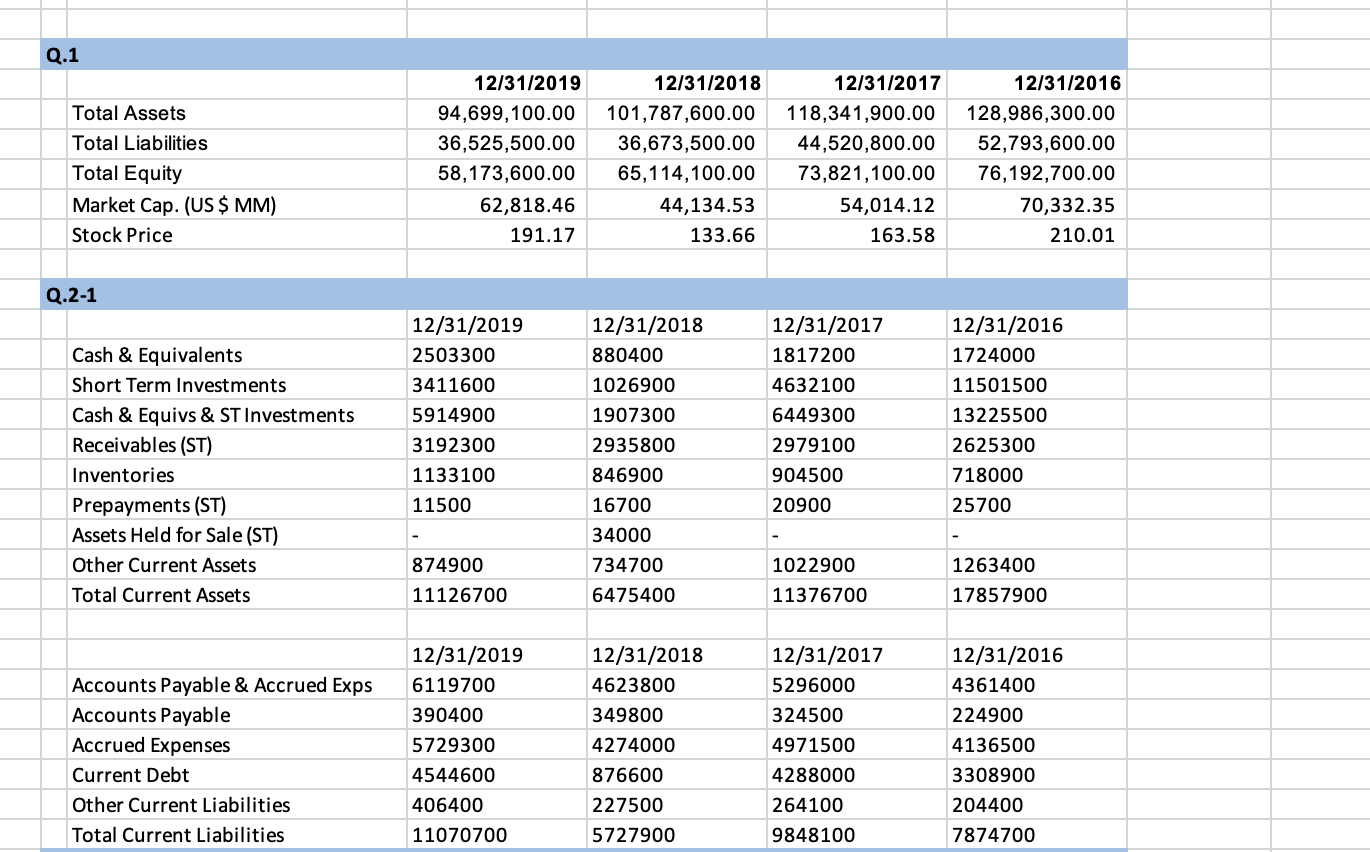
 Please find all of the information in the chart for Bank of America, the chart is just an example of how it should look so please find all that information for Bank of America and fill it how it looks on the chart I provided.
Q.1 Total Assets Total Liabilities Total Equity Market Cap. (US $ MM) Stock Price 12/31/2019 94,699,100.00 36,525,500.00 58,173,600.00 62,818.46 191.17 12/31/2018 101,787,600.00 36,673,500.00 65,114,100.00 44,134.53 133.66 12/31/2017 118,341,900.00 44,520,800.00 73,821,100.00 54,014.12 163.58 12/31/2016 128,986,300.00 52,793,600.00 76,192,700.00 70,332.35 210.01 Q.2-1 Cash & Equivalents Short Term Investments Cash & Equivs & ST Investments Receivables (ST) Inventories Prepayments (ST) Assets Held for Sale (ST) Other Current Assets Total Current Assets 12/31/2019 2503300 3411600 5914900 3192300 1133100 11500 12/31/2018 880400 1026900 1907300 2935800 846900 16700 34000 734700 6475400 12/31/2017 1817200 4632100 6449300 2979100 904500 20900 12/31/2016 1724000 11501500 13225500 2625300 718000 25700 874900 11126700 1022900 11376700 1263400 17857900 Accounts Payable & Accrued Exps Accounts Payable Accrued Expenses Current Debt Other Current Liabilities Total Current Liabilities 12/31/2019 6119700 390400 5729300 4544600 406400 11070700 12/31/2018 4623800 349800 4274000 876600 227500 5727900 12/31/2017 5296000 324500 4971500 4288000 264100 9848100 12/31/2016 4361400 224900 4136500 3308900 204400 7874700 Q.1 Total Assets Total Liabilities Total Equity Market Cap. (US $ MM) Stock Price 12/31/2019 94,699,100.00 36,525,500.00 58,173,600.00 62,818.46 191.17 12/31/2018 101,787,600.00 36,673,500.00 65,114,100.00 44,134.53 133.66 12/31/2017 118,341,900.00 44,520,800.00 73,821,100.00 54,014.12 163.58 12/31/2016 128,986,300.00 52,793,600.00 76,192,700.00 70,332.35 210.01 Q.2-1 Cash & Equivalents Short Term Investments Cash & Equivs & ST Investments Receivables (ST) Inventories Prepayments (ST) Assets Held for Sale (ST) Other Current Assets Total Current Assets 12/31/2019 2503300 3411600 5914900 3192300 1133100 11500 12/31/2018 880400 1026900 1907300 2935800 846900 16700 34000 734700 6475400 12/31/2017 1817200 4632100 6449300 2979100 904500 20900 12/31/2016 1724000 11501500 13225500 2625300 718000 25700 874900 11126700 1022900 11376700 1263400 17857900 Accounts Payable & Accrued Exps Accounts Payable Accrued Expenses Current Debt Other Current Liabilities Total Current Liabilities 12/31/2019 6119700 390400 5729300 4544600 406400 11070700 12/31/2018 4623800 349800 4274000 876600 227500 5727900 12/31/2017 5296000 324500 4971500 4288000 264100 9848100 12/31/2016 4361400 224900 4136500 3308900 204400 7874700
 Please find all of the information in the chart for Bank of America, the chart is just an example of how it should look so please find all that information for Bank of America and fill it how it looks on the chart I provided.


