

Answered step by step
Verified Expert Solution
Question
1 Approved Answer
Please follow the instruction! The two variables of interest are Percent Time Asleep and Longevity (in days). Graphics Requirements: All graphics must be constructed using


Please follow the instruction!
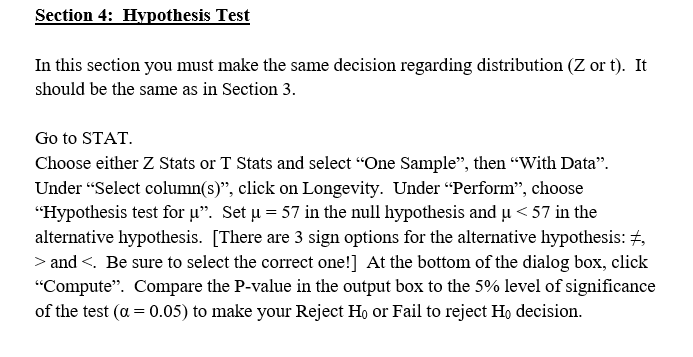
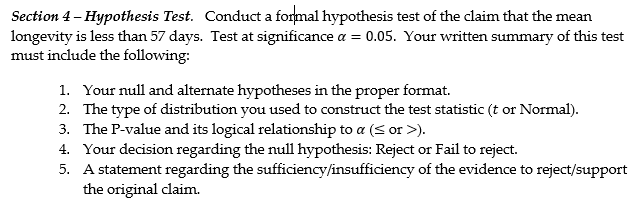
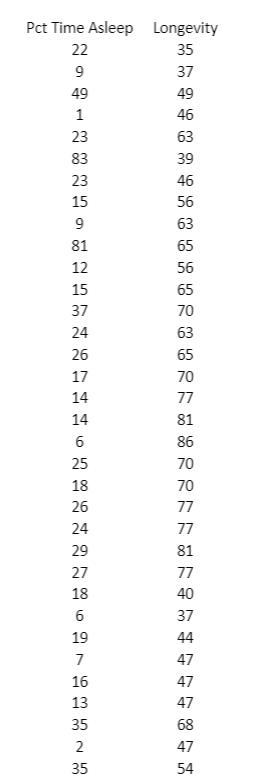
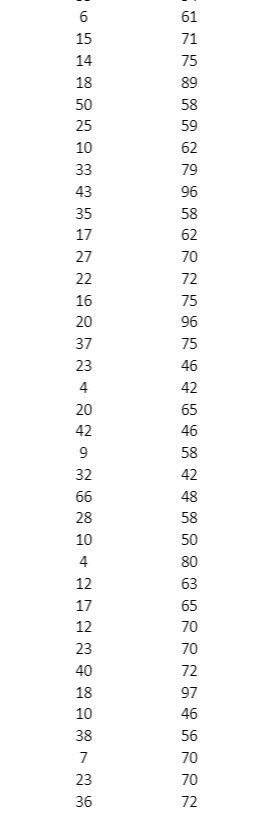
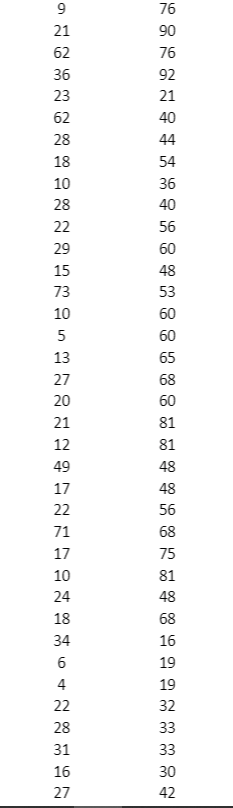
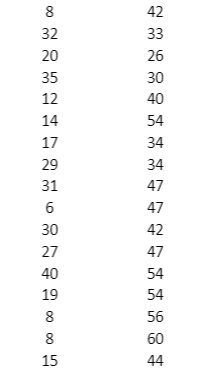
The two variables of interest are Percent Time Asleep and Longevity (in days). Graphics Requirements: All graphics must be constructed using StatCrunch, Excel, or other computer-based graphics program. Hand-drawn plots, photographic images of graphics, etc. are not acceptable. Rounding Rules: Unless otherwise specified, round all samples statistics to one decimal place and all probabilities (including p-values) to three decimal places. Add trailing zeroes as needed. Section 4: Hypothesis Test In this section you must make the same decision regarding distribution (Z or t). It should be the same as in Section 3. Go to STAT. Choose either Z Stats or T Stats and select One Sample, then "With Data. Under Select column(s), click on Longevity. Under Perform, choose Hypothesis test for u. Set u = 57 in the null hypothesis and u and <. be sure to select the correct one at bottom of dialog box click compute. compare p-value in output level significance test make your reject he or fail decision. section hypothesis test. conduct a formal claim that mean longevity is less than days. written summary this must include following: null and alternate hypotheses proper format. type distribution you used construct statistic normal its logical relationship>). 4. Your decision regarding the null hypothesis: Reject or Fail to reject. 5. A statement regarding the sufficiency/insufficiency of the evidence to reject/support the original claim. 37 Pct Time Asleep Longevity 22 35 9 49 1 46 23 83 39 49 63 23 15 9 81 12 15 65 70 37 24 26 77 17 14 14 6 25 9%%BB%8%88%& 18 26 24 77 81 77 29 27 18 6 19 7 16 13 35 2 35 68 54 - 61 71 75 89 58 59 62 79 96 62 B&BN% 75 96 75 46 42 6 15 14 18 50 25 10 33 43 35 17 27 22 16 20 37 23 4 20 42 9 32 66 28 10 4 12 17 12 23 40 18 10 38 7 23 36 65 46 58 42 48 58 50 80 63 65 70 70 72 97 46 56 70 70 72 76 90 76 92 21 40 9 21 62 36 23 62 28 18 10 28 22 29 44 54 36 40 56 60 15 48 53 60 60 73 10 5 13 27 20 65 21 12 49 68 60 81 81 48 48 56 17 68 75 81 48 22 71 17 10 24 18 34 6 4 22 28 31 16 27 68 16 19 19 32 33 33 30 42 8 32 20 35 12 14 17 29 31 6 30 27 40 42 33 26 30 40 54 34 34 47 47 42 47 54 54 56 60 44 19 8 8 15 The two variables of interest are Percent Time Asleep and Longevity (in days). Graphics Requirements: All graphics must be constructed using StatCrunch, Excel, or other computer-based graphics program. Hand-drawn plots, photographic images of graphics, etc. are not acceptable. Rounding Rules: Unless otherwise specified, round all samples statistics to one decimal place and all probabilities (including p-values) to three decimal places. Add trailing zeroes as needed. Section 4: Hypothesis Test In this section you must make the same decision regarding distribution (Z or t). It should be the same as in Section 3. Go to STAT. Choose either Z Stats or T Stats and select One Sample, then "With Data. Under Select column(s), click on Longevity. Under Perform, choose Hypothesis test for u. Set u = 57 in the null hypothesis and u and <. be sure to select the correct one at bottom of dialog box click compute. compare p-value in output level significance test make your reject he or fail decision. section hypothesis test. conduct a formal claim that mean longevity is less than days. written summary this must include following: null and alternate hypotheses proper format. type distribution you used construct statistic normal its logical relationship>). 4. Your decision regarding the null hypothesis: Reject or Fail to reject. 5. A statement regarding the sufficiency/insufficiency of the evidence to reject/support the original claim. 37 Pct Time Asleep Longevity 22 35 9 49 1 46 23 83 39 49 63 23 15 9 81 12 15 65 70 37 24 26 77 17 14 14 6 25 9%%BB%8%88%& 18 26 24 77 81 77 29 27 18 6 19 7 16 13 35 2 35 68 54 - 61 71 75 89 58 59 62 79 96 62 B&BN% 75 96 75 46 42 6 15 14 18 50 25 10 33 43 35 17 27 22 16 20 37 23 4 20 42 9 32 66 28 10 4 12 17 12 23 40 18 10 38 7 23 36 65 46 58 42 48 58 50 80 63 65 70 70 72 97 46 56 70 70 72 76 90 76 92 21 40 9 21 62 36 23 62 28 18 10 28 22 29 44 54 36 40 56 60 15 48 53 60 60 73 10 5 13 27 20 65 21 12 49 68 60 81 81 48 48 56 17 68 75 81 48 22 71 17 10 24 18 34 6 4 22 28 31 16 27 68 16 19 19 32 33 33 30 42 8 32 20 35 12 14 17 29 31 6 30 27 40 42 33 26 30 40 54 34 34 47 47 42 47 54 54 56 60 44 19 8 8 15
Step by Step Solution
There are 3 Steps involved in it
Step: 1

Get Instant Access to Expert-Tailored Solutions
See step-by-step solutions with expert insights and AI powered tools for academic success
Step: 2

Step: 3
Ace Your Homework with AI
Get the answers you need in no time with our AI-driven, step-by-step assistance
Get Started
Personal Finance Turning Money Into Wealth
Authors: Arthur Keown
8th Edition
0134730364, 978-0134730363