Please give details about answer
14.
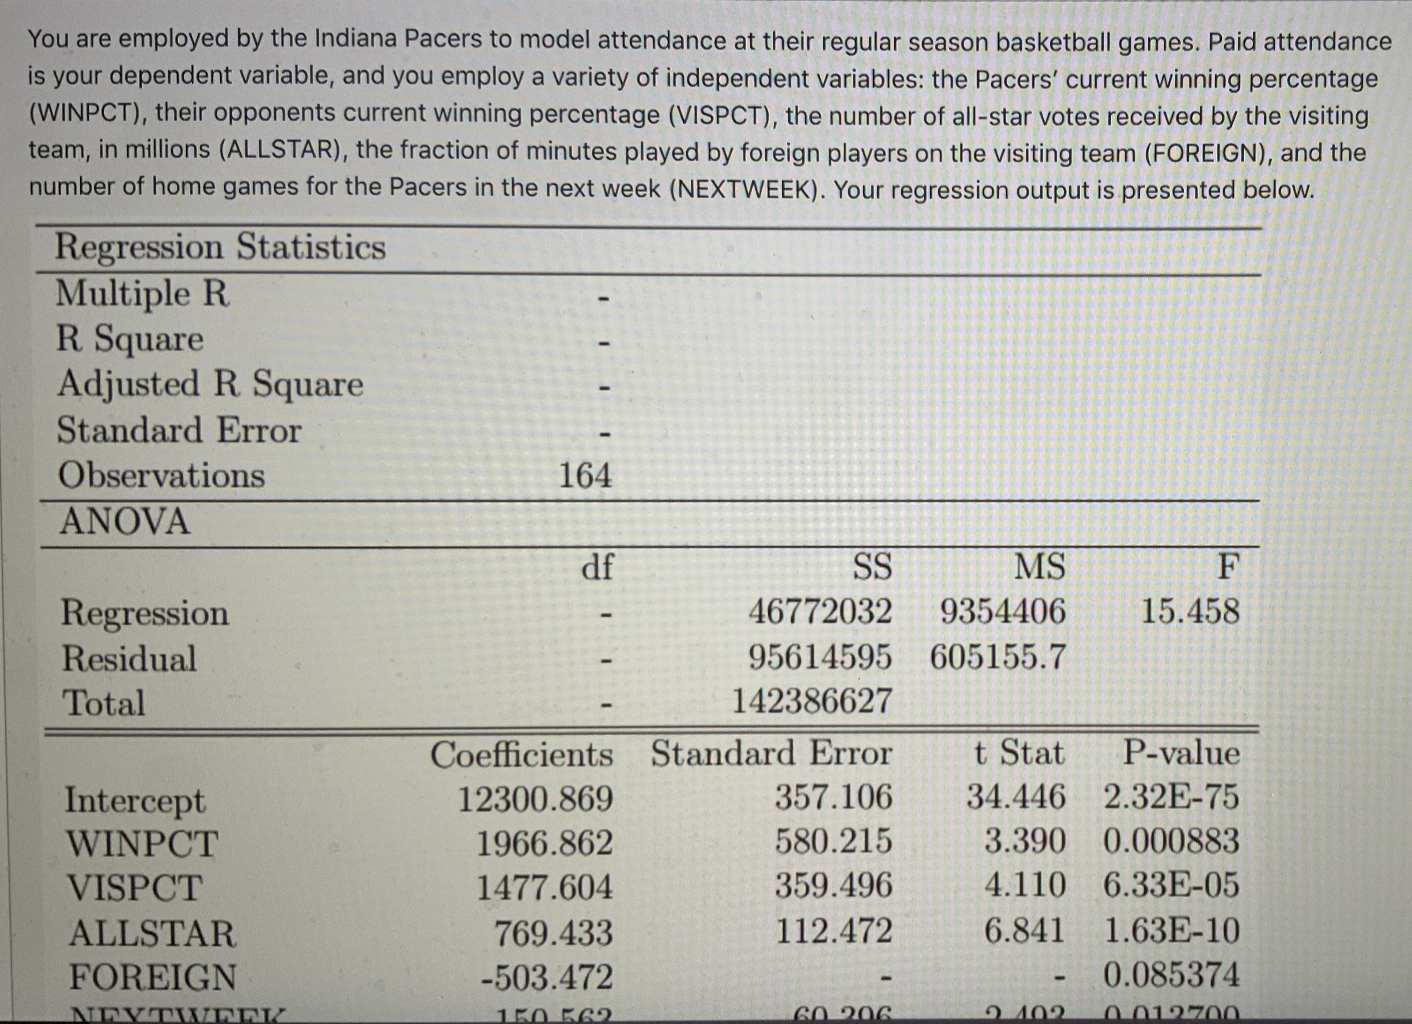
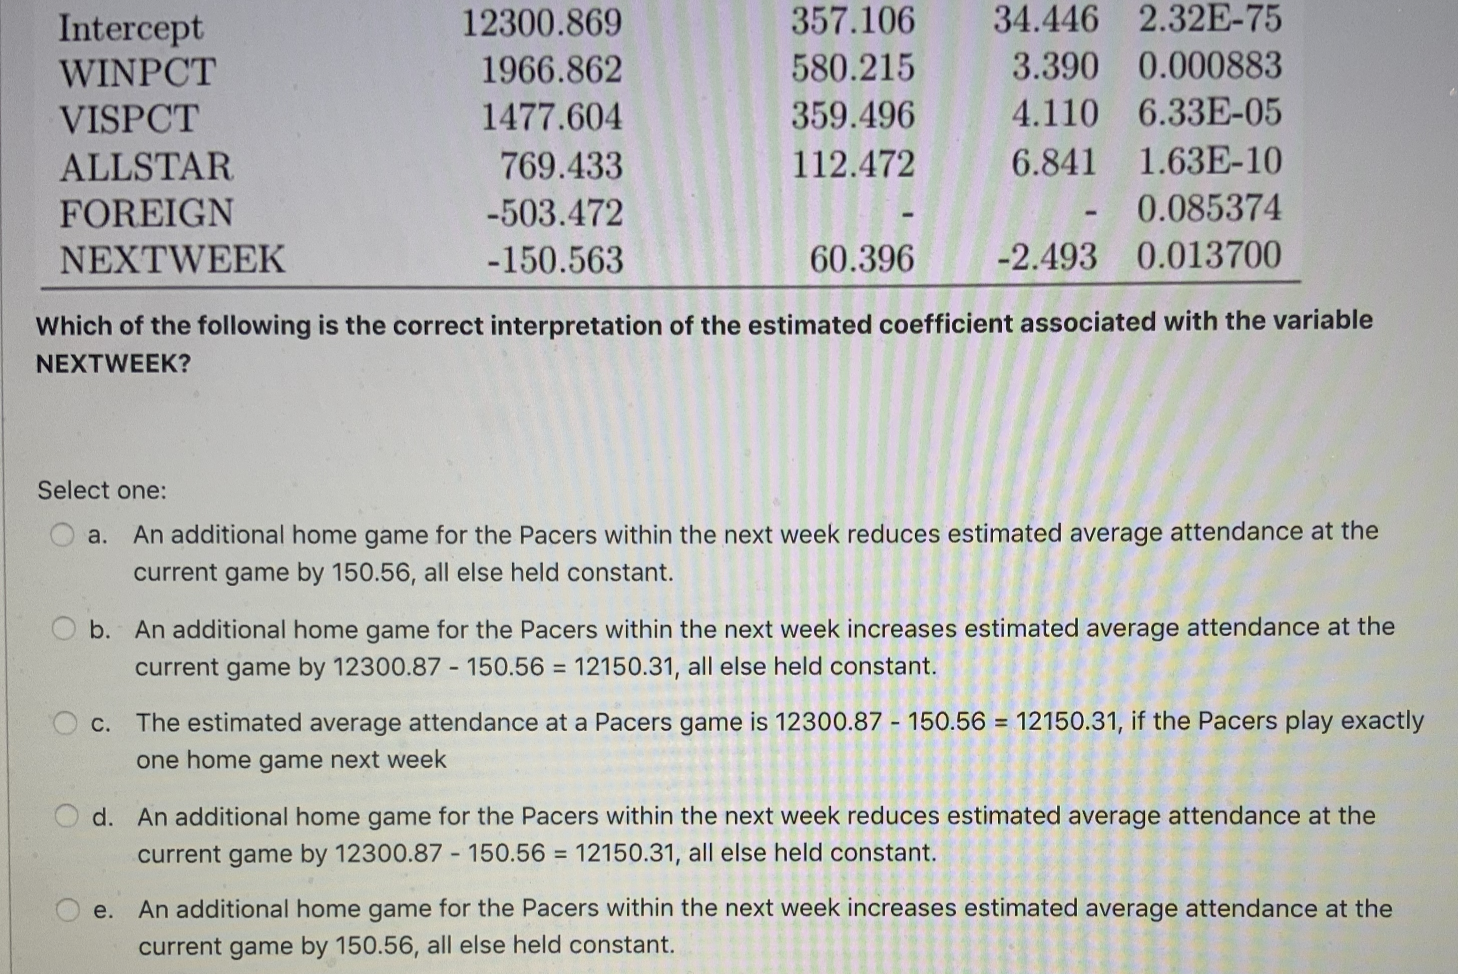
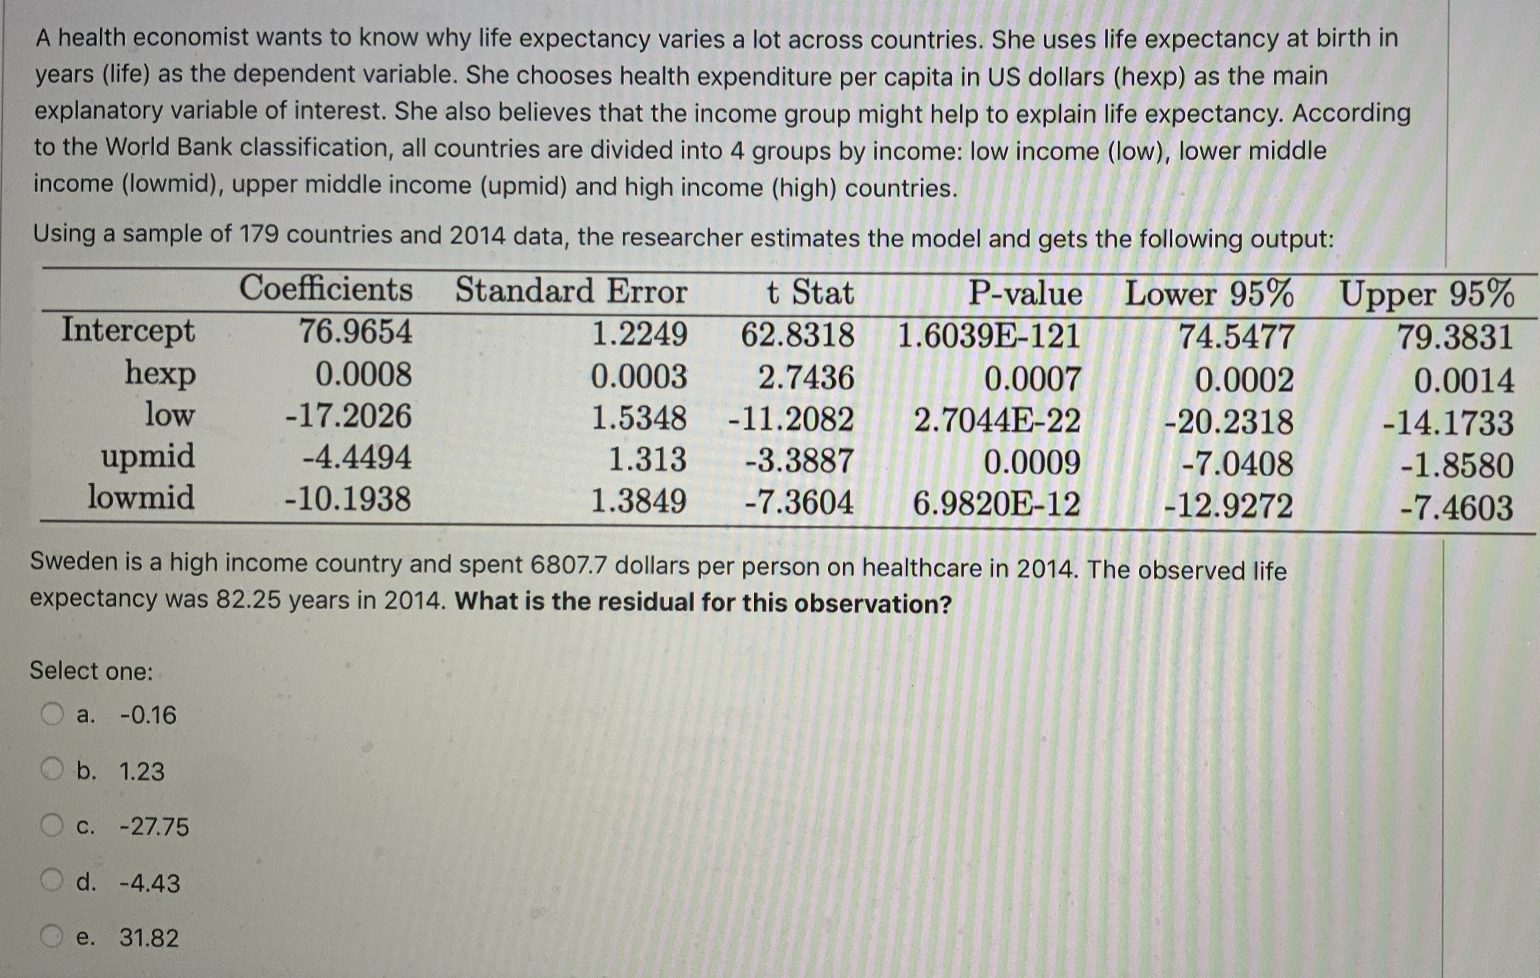
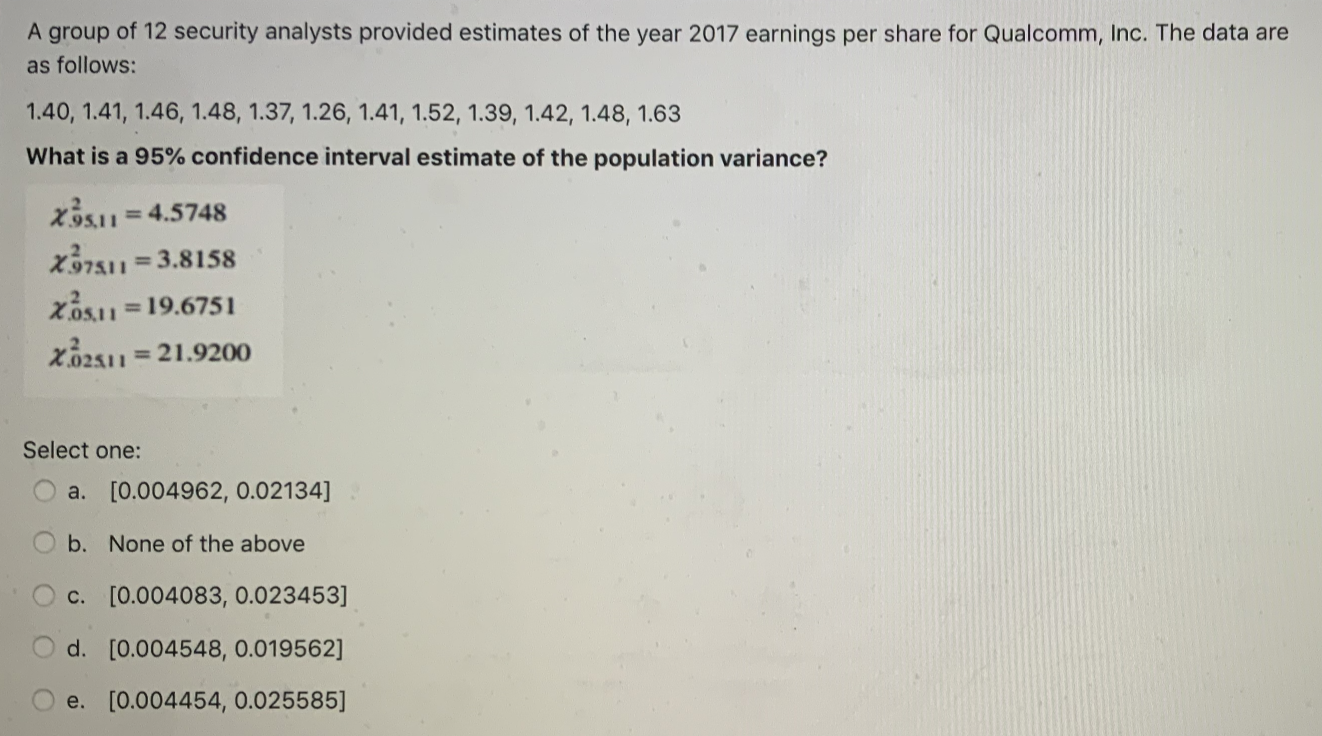
You are employed by the Indiana Pacers to model attendance at their regular season basketball games. Paid attendance is your dependent variable, and you employ a variety of independent variables: the Pacers' current winning percentage (WINPCT), their opponents current winning percentage (VISPCT), the number of all-star votes received by the visiting team, in millions (ALLSTAR), the fraction of minutes played by foreign players on the visiting team (FOREIGN), and the number of home games for the Pacers in the next week (NEXTWEEK). Your regression output is presented below. Regression Statistics Multiple R R Square Adjusted R Square Standard Error Observations 164 ANOVA df SS MS F Regression 1 46772032 9354406 15.458 Residual 95614595 605155.7 Total 142386627 Coefficients Standard Error t Stat P-value Intercept 12300.869 357.106 34.446 2.32E-75 WINPCT 1966.862 580.215 3.390 0.000883 VISPCT 1477.604 359.496 4.110 6.33E-05 ALLSTAR 769.433 112.472 6.841 1.63E-10 FOREIGN -503.472 0.085374 NYTWALK 150 562 60 206 2 102 0 012700Intercept 12300.869 357.106 34.446 2.32E-75 WINPCT 1966.862 580.215 3.390 0.000883 VISPCT 1477.604 359.496 4.110 6.33E-05 ALLSTAR 769.433 112.472 6.841 1.63E-10 FOREIGN -503.472 0.085374 NEXTWEEK -150.563 60.396 -2.493 0.013700 Which of the following is the correct interpretation of the estimated coefficient associated with the variable NEXTWEEK? Select one: O a. An additional home game for the Pacers within the next week reduces estimated average attendance at the current game by 150.56, all else held constant. O b. An additional home game for the Pacers within the next week increases estimated average attendance at the current game by 12300.87 - 150.56 = 12150.31, all else held constant. O c. The estimated average attendance at a Pacers game is 12300.87 - 150.56 = 12150.31, if the Pacers play exactly one home game next week O d. An additional home game for the Pacers within the next week reduces estimated average attendance at the current game by 12300.87 - 150.56 = 12150.31, all else held constant. O e. An additional home game for the Pacers within the next week increases estimated average attendance at the current game by 150.56, all else held constant.A health economist wants to know why life expectancy varies a lot across countries. She uses life expectancy at birth in years (life) as the dependent variable. She chooses health expenditure per capita in US dollars (hexp) as the main explanatory variable of interest. She also believes that the income group might help to explain life expectancy. According to the World Bank classification, all countries are divided into 4 groups by income: low income (low), lower middle income (lowmid), upper middle income (upmid) and high income (high) countries. Using a sample of 179 countries and 2014 data, the researcher estimates the model and gets the following output: Coefficients Standard Error t Stat P-value Lower 95% Upper 95% Intercept 76.9654 1.2249 62.8318 1.6039E-121 74.5477 79.3831 hexp 0.0008 0.0003 2.7436 0.0007 0.0002 0.0014 low -17.2026 1.5348 -11.2082 2.7044E-22 -20.2318 -14.1733 upmid -4.4494 1.313 -3.3887 0.0009 -7.0408 -1.8580 lowmid -10.1938 1.3849 -7.3604 6.9820E-12 -12.9272 -7.4603 Sweden is a high income country and spent 6807.7 dollars per person on healthcare in 2014. The observed life expectancy was 82.25 years in 2014. What is the residual for this observation? Select one: O a. -0.16 O b. 1.23 O c. -27.75 O d. -4.43 O e. 31.82A group of 12 security analysts provided estimates of the year 2017 earnings per share for Qualcomm, Inc. The data are as follows: 1.40, 1.41, 1.46, 1.48, 1.37, 1.26, 1.41, 1.52, 1.39, 1.42, 1.48, 1.63 What is a 95% confidence interval estimate of the population variance? X.95.11 = 4.5748 X.97511 = 3.8158 X.03.11 = 19.6751 X.0251 1 = 21.9200 Select one: O a. [0.004962, 0.02134] O b. None of the above O c. [0.004083, 0.023453] O d. [0.004548, 0.019562] O e. [0.004454, 0.025585]


