Please give me the r-code I need (im making a quarto file)
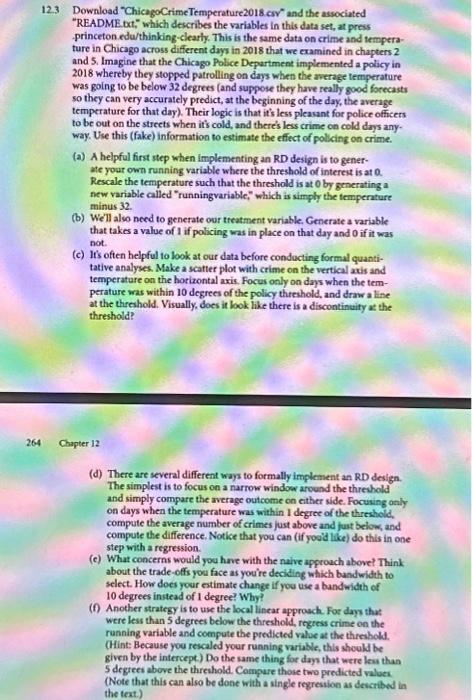
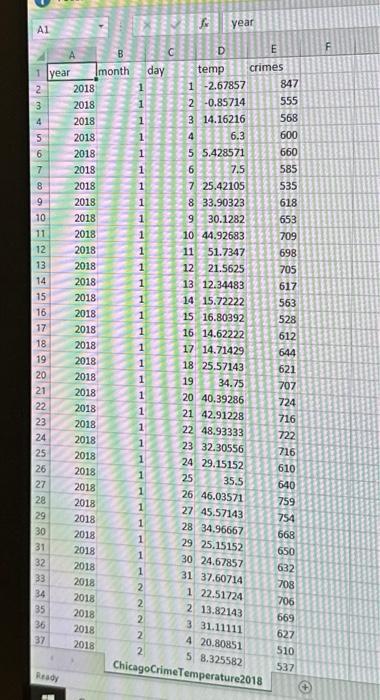
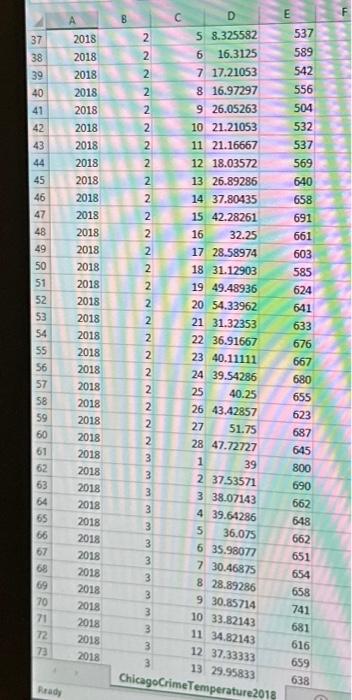
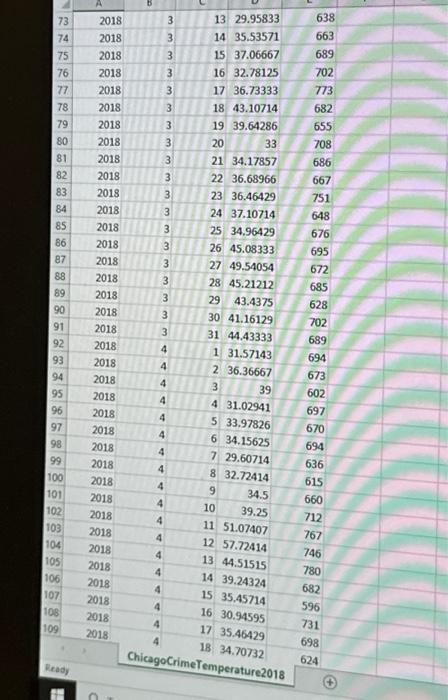
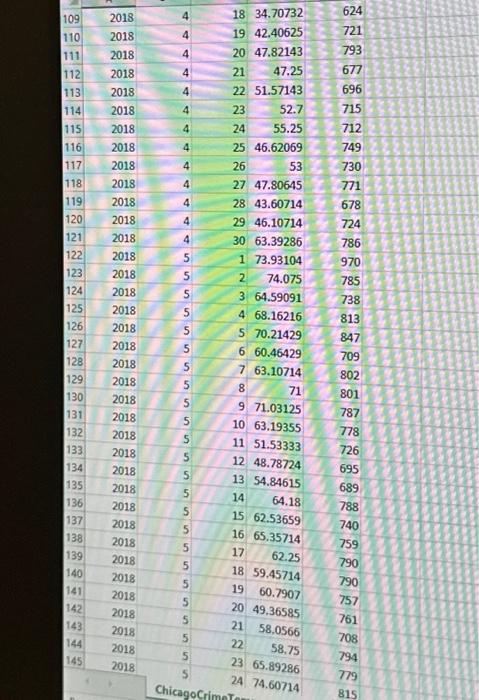
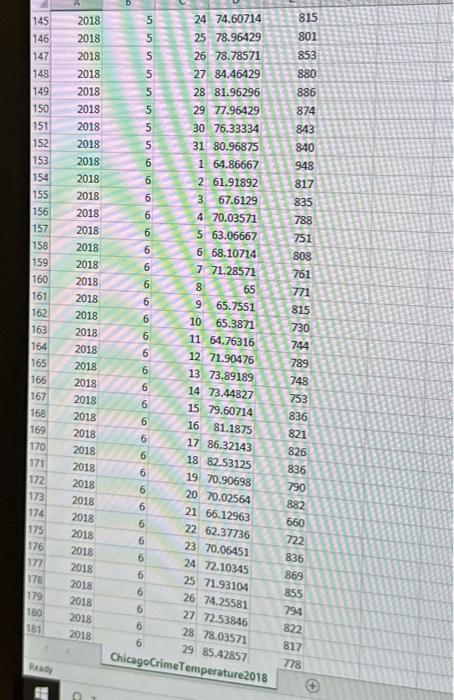
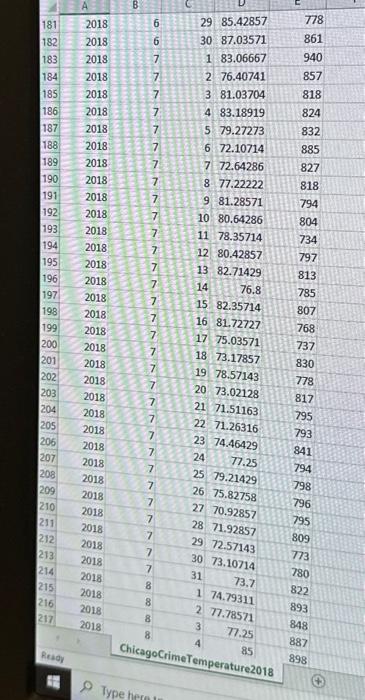
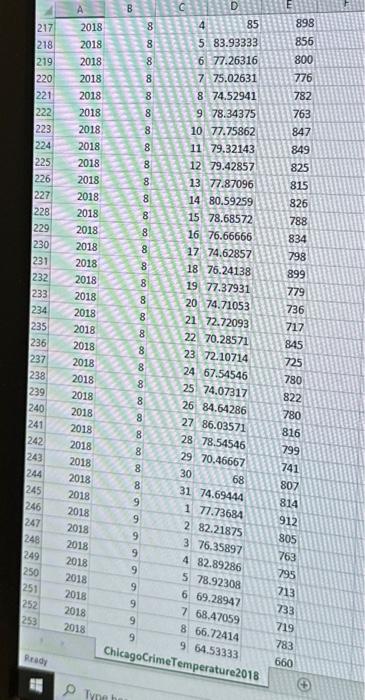
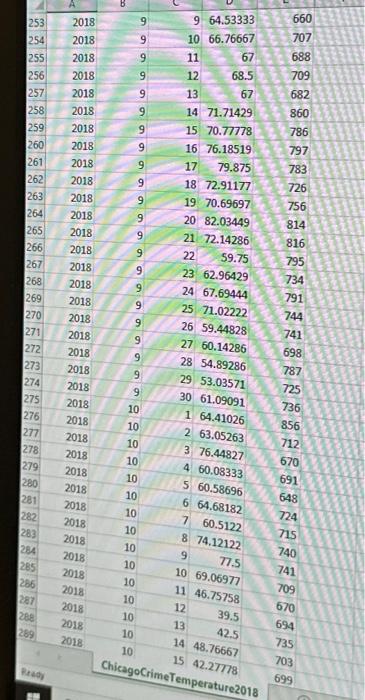
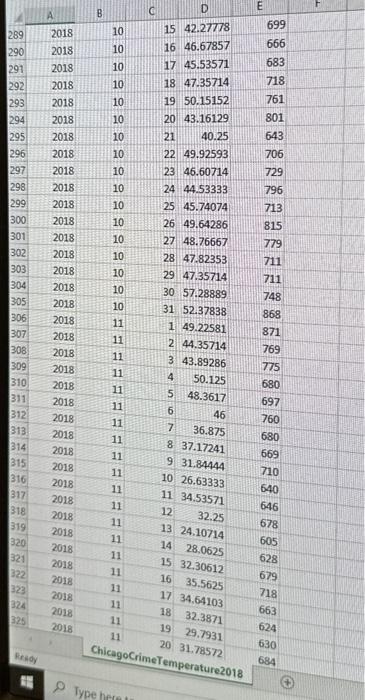
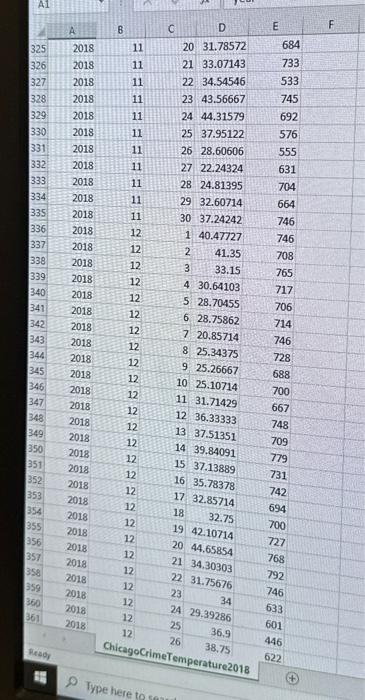
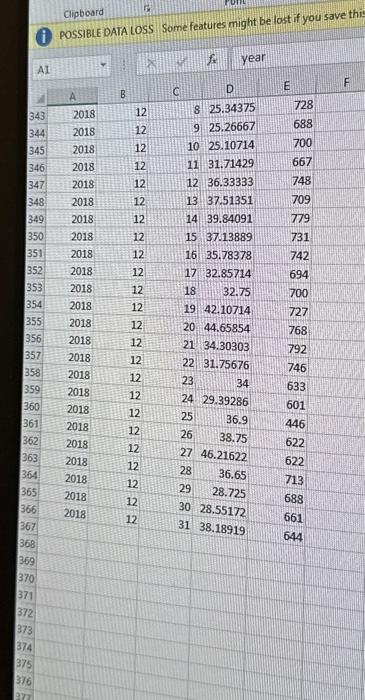
"README tot", which describes the variables in this data set, at press princeton edu/thinking-clearly. This is the same data on crime and temperature in Chicago across different days in 2018 that we examined in chapters 2 and 5. Imagine that the Chicago Police Department implemented a policy in 2018 whereby they stopped patrolling on days when the average temperature was going to be below 32 degrees (and suppose they have really good forecasts so they can very accurately predict, at the beginning of the day, the average temperature for that day). Their logic is that it's less pleasant for police officers to be out on the streets when it's cold, and there's less crime on cold days any. way. Use this (fake) information to estimate the effect of policing on crime. (a) A helpful first step when implementing an RD design is to generate your own running variable where the threshold of interest is at 0. Rescale the temperature such that the threshold is at 0 by generating a new variable called "runningvariable," which is simply the temperature minus 32. (b) We'll also need to generate our tteatment variable. Generate a variable that takes a value of 1 if policing was in place on that day and 0 if it was not. (c) Ins often helpful to look at our data before conducting formal quantitative analyses. Make a scatter plot with crime on the vertical axis and temperature on the horizontal axis. Focus only on days when the temperature was within 10 degrees of the policy threshold, and draw a line at the threshold. Visually, does it look like there is a discontinuity at the threshold? Chapter 12 (d) There are several different ways to formally implement an RD design. The simplest is to focus on a narrow window around the threshold and simply compare the average outcome on either side. Focusing only on days when the temperature was within 1 degree of the threshold, compute the average number of crimes just above and fast below, and compute the difference. Notice that you can (if you'd like) do this in one step with a regression. (e) What concerns would you have with the naive approach above? Think about the trade-offs you face as youre deciding which bundwidth to select. How does your estimate change if you use a bandwidth of 10 degrees instead of 1 degree? Why? (f) Another strategy is to use the local linear approsch. For days that were less than 5 degrees below the threshold, rogress crime on the running variable and compute the predicted valoe at the threshold. (Hint: Because you rescaled your running variable, this should be given by the intercept) Do the same thing for day that were leas than 5 degrees above the threshold. Compare those two predicted valoes. (Note that this can also be done with a single regression as described in the teat.) A1 fr. year Ready ChicagoCrimeTemperature 2018 \begin{tabular}{|c|c|c|c|c|} \hline 109 & 2018 & 4 & 18 & 34.70732 \\ \hline 110 & 2018 & 4 & 19 & 42.40625 \\ \hline 111 & 2018 & 4 & 20 & 47.82143 \\ \hline 112 & 2018 & 4 & 21 & 47.25 \\ \hline 13 & 2018 & 4 & 22 & 51.57143 \\ \hline 4 & 2018 & 4 & 23 & 52.7 \\ \hline 15 & 2018 & 4 & 24 & 55.25 \\ \hline 116 & 2018 & 4 & 25 & 46.62069 \\ \hline 117 & 2018 & 4 & 26 & 53 \\ \hline 118 & 2018 & 4 & 27 & 47.80645 \\ \hline 119 & 2018 & 4 & 28 & 43.60714 \\ \hline 120 & 2018 & 4 & 29 & 46.10714 \\ \hline 121 & 2018 & 4 & 30 & 63.39286 \\ \hline 122 & 2018 & 5 & 1 & 73.93104 \\ \hline 123 & 2018 & 5 & 2 & 74.075 \\ \hline 124 & 2018 & 5 & 3 & 64.59091 \\ \hline 125 & 2018 & 5 & 4 & 68.16216 \\ \hline 126 & 2018 & 5 & 5 & 70.21429 \\ \hline 127 & 2018 & 5 & 6 & 60.46429 \\ \hline 128 & 2018 & 5 & 7 & 63.10714 \\ \hline 129 & 2018 & 5 & 8 & 71 \\ \hline 130 & 2018 & 5 & 9 & 71.03125 \\ \hline 131 & 2018 & 5 & 10 & 63.19355 \\ \hline 132 & 2018 & 5 & 11 & 51.53333 \\ \hline 133 & 2018 & 5 & 12 & 48.78724 \\ \hline 134 & 2018 & s & 13 & 54.84615 \\ \hline 135 & 2018 & 5 & 14 & 64.18 \\ \hline 136 & 2018 & 5 & 15 & 62.53659 \\ \hline 137 & 2018 & 5 & 16 & 65.35714 \\ \hline 138 & 2018 & 5 & 17 & 62.25 \\ \hline 139 & 2018 & 5 & 18 & 59,45714 \\ \hline 140 & 2018 & 5 & 19 & 60.7907 \\ \hline 141 & 2018 & 5 & 20 & 49.36585 \\ \hline 142 & 2018 & 5 & 21 & 58,0566 \\ \hline 143 & 2018 & 5 & 22 & 58.75 \\ \hline 144 & 2018 & 5 & 23 & 65.89286 \\ \hline 145 & 2018 & 5 & 24 & 74.60714 \\ \hline \end{tabular} A1 Type here to Clipboard (i) pOSSIBLEDATA LOSS some features might be lost if you save this A1 year \begin{tabular}{|c|c|c|c|c|c|} \hline 4 & A & B & c & D & E \\ \hline 343 & 2018 & 12 & 8 & 25.34375 & 728 \\ \hline 344 & 2018 & 12 & 9 & 25.26667 & 688 \\ \hline 345 & 2018 & 12 & 10 & 25.10714 & 700 \\ \hline 346 & 2018 & 12 & 11 & 31.71429 & 667 \\ \hline 347 & 2018 & 12 & 12 & 36.33333 & 748 \\ \hline 348 & 2018 & 12 & 13 & 37.51351 & 709 \\ \hline 349 & 2018 & 12 & 14 & 39.84091 & 779 \\ \hline 350 & 2018 & 12 & 15 & 37.13889 & 731 \\ \hline 351 & 2018 & 12 & 16 & 35.78378 & 742 \\ \hline 352 & 2018 & 12 & 17 & 32.85714 & 694 \\ \hline 353 & 2018 & 12 & 18 & 32.75 & 700 \\ \hline 354 & 2018 & 12 & 19 & 42.10714 & 727 \\ \hline 355 & 2018 & 12 & 20 & 44.65854 & 768 \\ \hline 356 & 2018 & 12 & 21 & 34.30303 & 792 \\ \hline 357 & 2018 & 12 & 22 & 31.75676 & 746 \\ \hline 358 & 2018 & 12 & 23 & 34 & 633 \\ \hline 359 & 2018 & 12 & 24 & 29.39286 & 601 \\ \hline 360 & 2018 & 12 & 25 & 36.9 & 446 \\ \hline 361. & 2018 & 12 & 26 & 38.75 & 622 \\ \hline 362 & 2018 & 12 & 27 & 46.21622 & 622 \\ \hline 363 & 2018 & 12 & 28 & 36.65 & 713 \\ \hline 364. & 2018 & 12 & 29 & 28.725 & 688 \\ \hline 365 & 2018 & 12 & 30 & 28.55172 & 661 \\ \hline 366 & 2018 & 12 & 31 & 38.18919 & 644 \\ \hline \end{tabular}