

Answered step by step
Verified Expert Solution
Question
1 Approved Answer
please give ucl and lcl Refer to Table 56.1. Factors for Computing Control Chart uimits (3 sigma) for this problem Sampling 4 pieces of precision
please give ucl and lcl 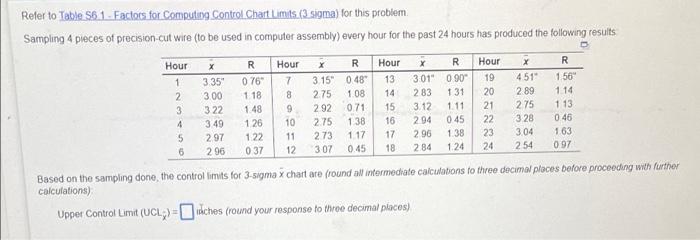
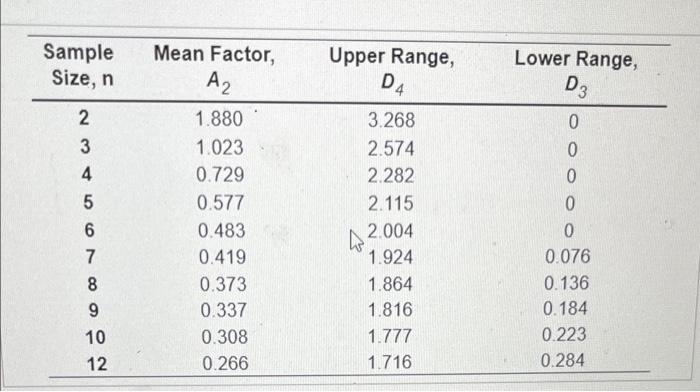
Refer to Table 56.1. Factors for Computing Control Chart uimits (3 sigma) for this problem Sampling 4 pieces of precision cut wire (to be used in computer assembly) every hour for the past 24 hours has produced the following results Hour 1 31 1 2 3 4 5 6 X 335 3.00 322 349 2.97 296 R 0 769 1 18 1.48 126 122 037 Hour 7 8 9 10 11 12 x 3 15" 2.75 292 2.75 273 307 R 0489 1.08 071 138 1 17 0.45 Hour 13 14 15 16 17 18 X R 301" 090 283 3.12 1 11 294 045 296 138 284 124 Hour 19 20 21 22 23 24 x 451" 2 89 275 3.28 304 254 R 156" 114 1 13 0.46 163 097 Based on the sampling done, the control limits for 3-sigma x chart are (round all informediate calculations to three decimal places before proceeding with further calculations) Upper Control Limit (UCLA) -ches (round your response to three decimal places) Sample Size, n Upper Range, Lower Range, D4 D3 2 3 4 5 Mean Factor, A2 1.880 1.023 0.729 0.577 0.483 0.419 0.373 0.337 0.308 0.266 6 7 8 9 10 12 3.268 2.574 2.282 2.115 2.004 1.924 1.864 1.816 1.777 1.716 0 0 0 0 0 0.076 0.136 0.184 0.223 0.284 Step by Step Solution
There are 3 Steps involved in it
Step: 1

Get Instant Access to Expert-Tailored Solutions
See step-by-step solutions with expert insights and AI powered tools for academic success
Step: 2

Step: 3
Ace Your Homework with AI
Get the answers you need in no time with our AI-driven, step-by-step assistance
Get Started
Risk Adjusted Performance And Bank Governance Structures
Authors: Christoph Böhm
1st Edition
3631639163, 3653027306, 9783631639160, 9783653027303