Please help
1
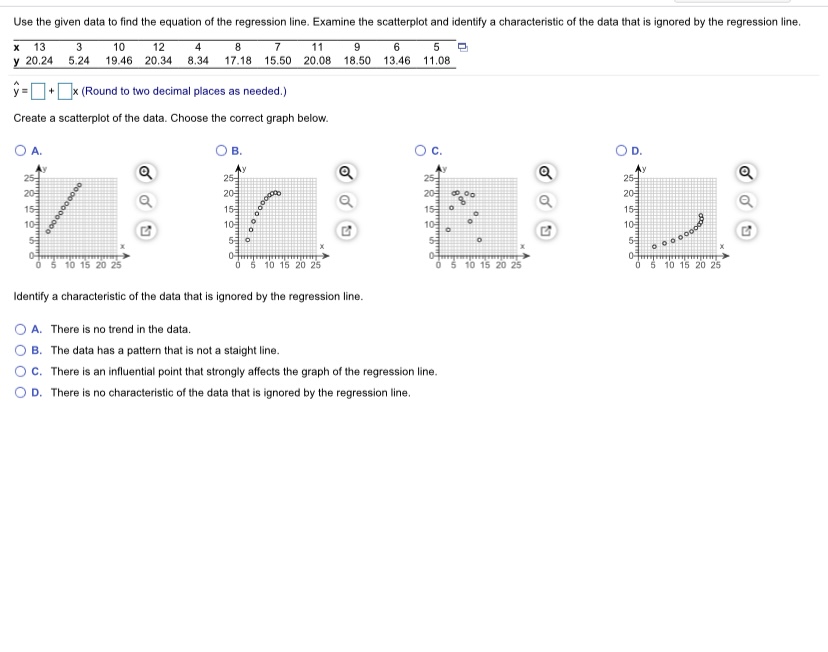
Use the given data to find the equation of the regression line. Examine the scatterplot and identify a characteristic of the data that is ignored by the regression line. x 13 3 10 12 4 8 11 9 6 y 20.24 5.24 19.46 20.34 8.34 17.18 15.50 20.08 18.50 13.46 11.08 y =[+x (Round to two decimal places as needed.) Create a scatterplot of the data. Choose the correct graph below. O A. O B. O c. O D. 25- a 25- Q 25 25- Q 20 a 205 a 205 205 15- 15 15- O 10 105 10- 5 10 15 20 25 6 10 15 20 25 5 10 15 20 25 6 10 15 20 25 Identify a characteristic of the data that is ignored by the regression line. O A. There is no trend in the data. O B. The data has a pattern that is not a staight line. O C. There is an influential point that strongly affects the graph of the regression line. O D. There is no characteristic of the data that is ignored by the regression line.Fifty-four wild bears were anesthetized, and then their weights and chest sizes were measured and listed in a data set. Correlation Results Results are shown in the accompanying display. Is there sufficient evidence to support the claim that there is a linear correlation between the weights of bears and their chest sizes? When measuring an anesthetized bear, is it easier to measure Correlation coeff, r: 0.976766 chest size than weight? If so, does it appear that a measured chest size can be used to predict the weight? Use a significance Critical r: + 0.2680855 level of a = 0.05 P-value (two tailed): 0.000 Determine the null and alternative hypotheses. Hip O (Type integers or decimals. Do not round. ) Identify the correlation coefficient, r. r=(Round to three decimal places as needed.) Identify the critical value(s). Round to three decimal places as needed. ) A. There are two critical values atr= + O B. There is one critical value at r =]. Is there sufficient evidence to support the claim that there is a linear correlation between the weights of bears and their chest sizes? Choose the correct answer below and, if necessary, fill in the answer box within your choice. (Round to three decimal places as needed.) O A. Yes, because the test statistic |falls between the critical values. O B. No, because the absolute value of the test statistic |exceeds the critical value. O C. Yes, because the absolute value of the test statistic exceeds the critical value. O D. No, because the test statistic |falls between the critical values. O E. The answer cannot be determined from the given information. When measuring an anesthetized bear, is it easier to measure chest size than weight? If so, does it appear that a measured chest size can be used to predict the weight? O A. Yes, it is easier to measure a chest size than a weight because measuring weight would require lifting the bear onto the scale. The chest size could be used to predict weight because there is a linear correlation between the two. O B. Yes, it is easier to measure a chest size than a weight because measuring weight would require lifting the bear onto the scale. The chest size could not be used to predict weight because there is too much variance in the weight of the bears. O C. No, it is easier to measure weight than chest size because the chest is not a flat surface. O D. Yes, it is easier to measure a chest size than a weight because measuring weight would require lifting the bear onto the scale. The chest size could not be used to predict weight because there is not a linear correlation between the two.if Question Help Use the given data set to complete parts (a) through (c) below. (Use a = 0.05.) 10 9.14 8 8.14 13 8.75 9 8.78 11 9.25 14 8.11 6 6.12 4 12 9.13 7.27 5 4.75 Click here to view a table of critical values for the correlation coefficient. a. Construct a scatterplot. Choose the correct graph below. O A. O B O c. OD. 10- Q Q O Q ....... b. Find the linear correlation coefficient, r, then determine whether there is sufficient evidence to support the claim of a linear correlation between the two variables. The linear correlation coefficient is r=]. (Round to three decimal places as needed.) Using the linear correlation coefficient found in the previous step, determine whether there is sufficient evidence to support the claim of a linear correlation between the two variables. Choose the correct answer below. O A. There is insufficient evidence to support the claim of a nonlinear correlation between the two variables. O B. There is sufficient evidence to support the claim of a linear correlation between the two variables. O C. There is sufficient evidence to support the claim of a nonlinear correlation between the two variables. O D. There is insufficient evidence to support the claim of a linear correlation between the two variables. c. Identify the feature of the data that would be missed if part (b) was completed without constructing the scatterplot. Choose the correct answer below. O A. The scatterplot reveals a distinct pattern that is a straight-line pattern with positive slope. O B. The scatterplot does not reveal a distinct pattern. O C. The scatterplot reveals a distinct pattern that is not a straight-line pattern. O D. The scatterplot reveals a distinct pattern that is a straight-line pattern with negative slope.For 50 randomly selected speed dates, attractiveness ratings by males of their female date partners (x) are recorded along with the attractiveness ratings by females of their male date partners (y); the ratings range from 1 to 10. The 50 paired ratings yield x = 6.3, y =6.0, r= - 0.162, P-value = 0.261, and y = 7.21 -0.199x. Find the significance level. best predicted value of y (attractiveness rating by female of male) for a date in which the attractiveness rating by the male of the female is x = 5. Use a 0.05 The best predicted value of y when x = 5 is . (Round to one decimal place as needed.)Listed below are annual data for various years. The data are weights (metric tons) of imported lemons and car crash fatality rates per 100,000 population. Construct a scatterplot, find the value of the linear correlation coefficient r, and find the P-value using of = 0.05. Is there sufficient evidence to conclude that there is a linear correlation between lemon imports and crash fatality rates? Do the results suggest that imported lemons cause car fatalities? Lemon Imports 231 266 358 482 532 Crash Fatality Rate 15.9 15.7 15.5 15.3 14.8 What are the null and alternative hypotheses? OA. Hip=0 OB. Hoip#o Hy: p 0 Hip#0 Construct a scatterplot. Choose the correct graph below. O A. OB. O C. O D. 17- Ay 17- Q 17- Q 16- 16 15 15 15- C 15 200 400 600 200 400 600 200 400 600 14 200 400 600 The linear correlation coefficient is r=]. [Round to three decimal places as needed.) The test statistic is t =]. (Round to three decimal places as needed.) The P-value is. (Round to three decimal places as needed.) Because the P-value is than the significance level 0.05, there sufficient evidence to support the claim that there is a linear correlation between lemon imports and crash fatality rates for a significance level of a = 0.05. Do the results suggest that imported lemons cause car fatalities? O A. The results do not suggest any cause-effect relationship between the two variables. O B. The results suggest that an increase in imported lemons causes in an increase in car fatality rates. O C. The results suggest that an increase in imported lemons causes car fatality rates to remain the same. O D. The results suggest that imported lemons cause car fatalities
