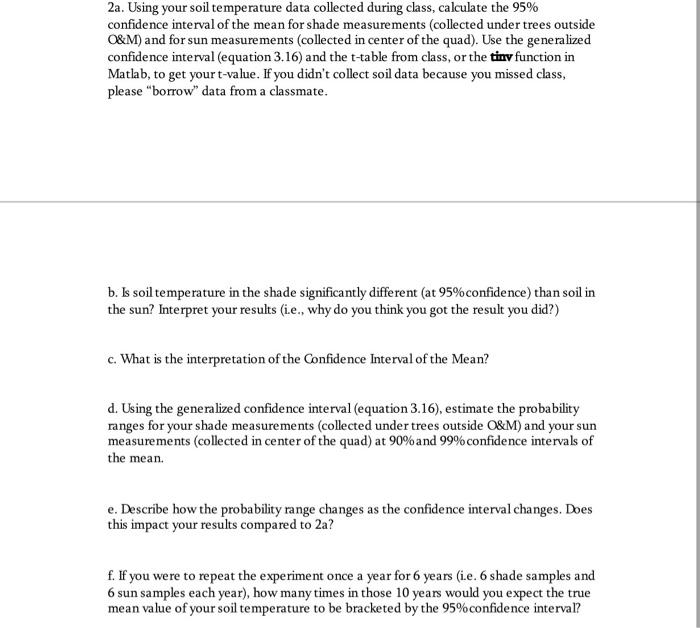
Question: please help 2a. Using your soil temperature data collected during class, calculate the 95% confidence interval of the mean for shade measurements (collected under trees


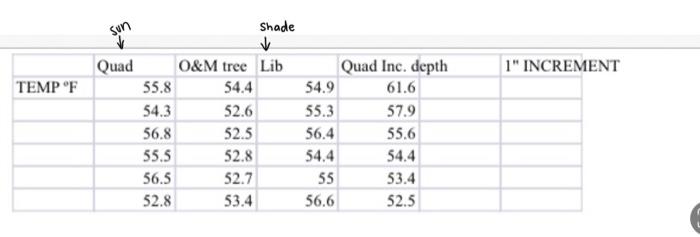
2a. Using your soil temperature data collected during class, calculate the 95% confidence interval of the mean for shade measurements (collected under trees outside O&M) and for sun measurements (collected in center of the quad). Use the generalized confidence interval (equation 3.16) and the t-table from class, or the tiny function in Matlab, to get your t-value. If you didn't collect soil data because you missed class, please "borrow" data from a classmate. b. Is soil temperature in the shade significantly different (at 95% confidence) than soil in the sun? Interpret your results (ie., why do you think you got the result you did?) c. What is the interpretation of the Confidence Interval of the Mean? d. Using the generalized confidence interval (equation 3.16), estimate the probability ranges for your shade measurements (collected under trees outside O&M) and your sun measurements (collected in center of the quad) at 90% and 99%confidence intervals of the mean. e. Describe how the probability range changes as the confidence interval changes. Does this impact your results compared to 2a? f. If you were to repeat the experiment once a year for 6 years (i.e. 6 shade samples and 6 sun samples each year), how many times in those 10 years would you expect the true mean value of your soil temperature to be bracketed by the 95%confidence interval? sun Shade Quad 1" INCREMENT TEMPF 54.4 O&M tree Lib 55.8 54.3 52.6 56.8 52.5 55.5 52.8 56.5 52.7 52.8 53.4 Quad Inc. depth 54.9 61.6 55.3 57.9 56.4 55.6 54.4 54.4 55 53.4 56.6 52.5 2a. Using your soil temperature data collected during class, calculate the 95% confidence interval of the mean for shade measurements (collected under trees outside O&M) and for sun measurements (collected in center of the quad). Use the generalized confidence interval (equation 3.16) and the t-table from class, or the tiny function in Matlab, to get your t-value. If you didn't collect soil data because you missed class, please "borrow" data from a classmate. b. Is soil temperature in the shade significantly different (at 95% confidence) than soil in the sun? Interpret your results (ie., why do you think you got the result you did?) c. What is the interpretation of the Confidence Interval of the Mean? d. Using the generalized confidence interval (equation 3.16), estimate the probability ranges for your shade measurements (collected under trees outside O&M) and your sun measurements (collected in center of the quad) at 90% and 99%confidence intervals of the mean. e. Describe how the probability range changes as the confidence interval changes. Does this impact your results compared to 2a? f. If you were to repeat the experiment once a year for 6 years (i.e. 6 shade samples and 6 sun samples each year), how many times in those 10 years would you expect the true mean value of your soil temperature to be bracketed by the 95%confidence interval? sun Shade Quad 1" INCREMENT TEMPF 54.4 O&M tree Lib 55.8 54.3 52.6 56.8 52.5 55.5 52.8 56.5 52.7 52.8 53.4 Quad Inc. depth 54.9 61.6 55.3 57.9 56.4 55.6 54.4 54.4 55 53.4 56.6 52.5
Step by Step Solution
There are 3 Steps involved in it

Get step-by-step solutions from verified subject matter experts


