Answered step by step
Verified Expert Solution
Link Copied!

Question

1 Approved Answer

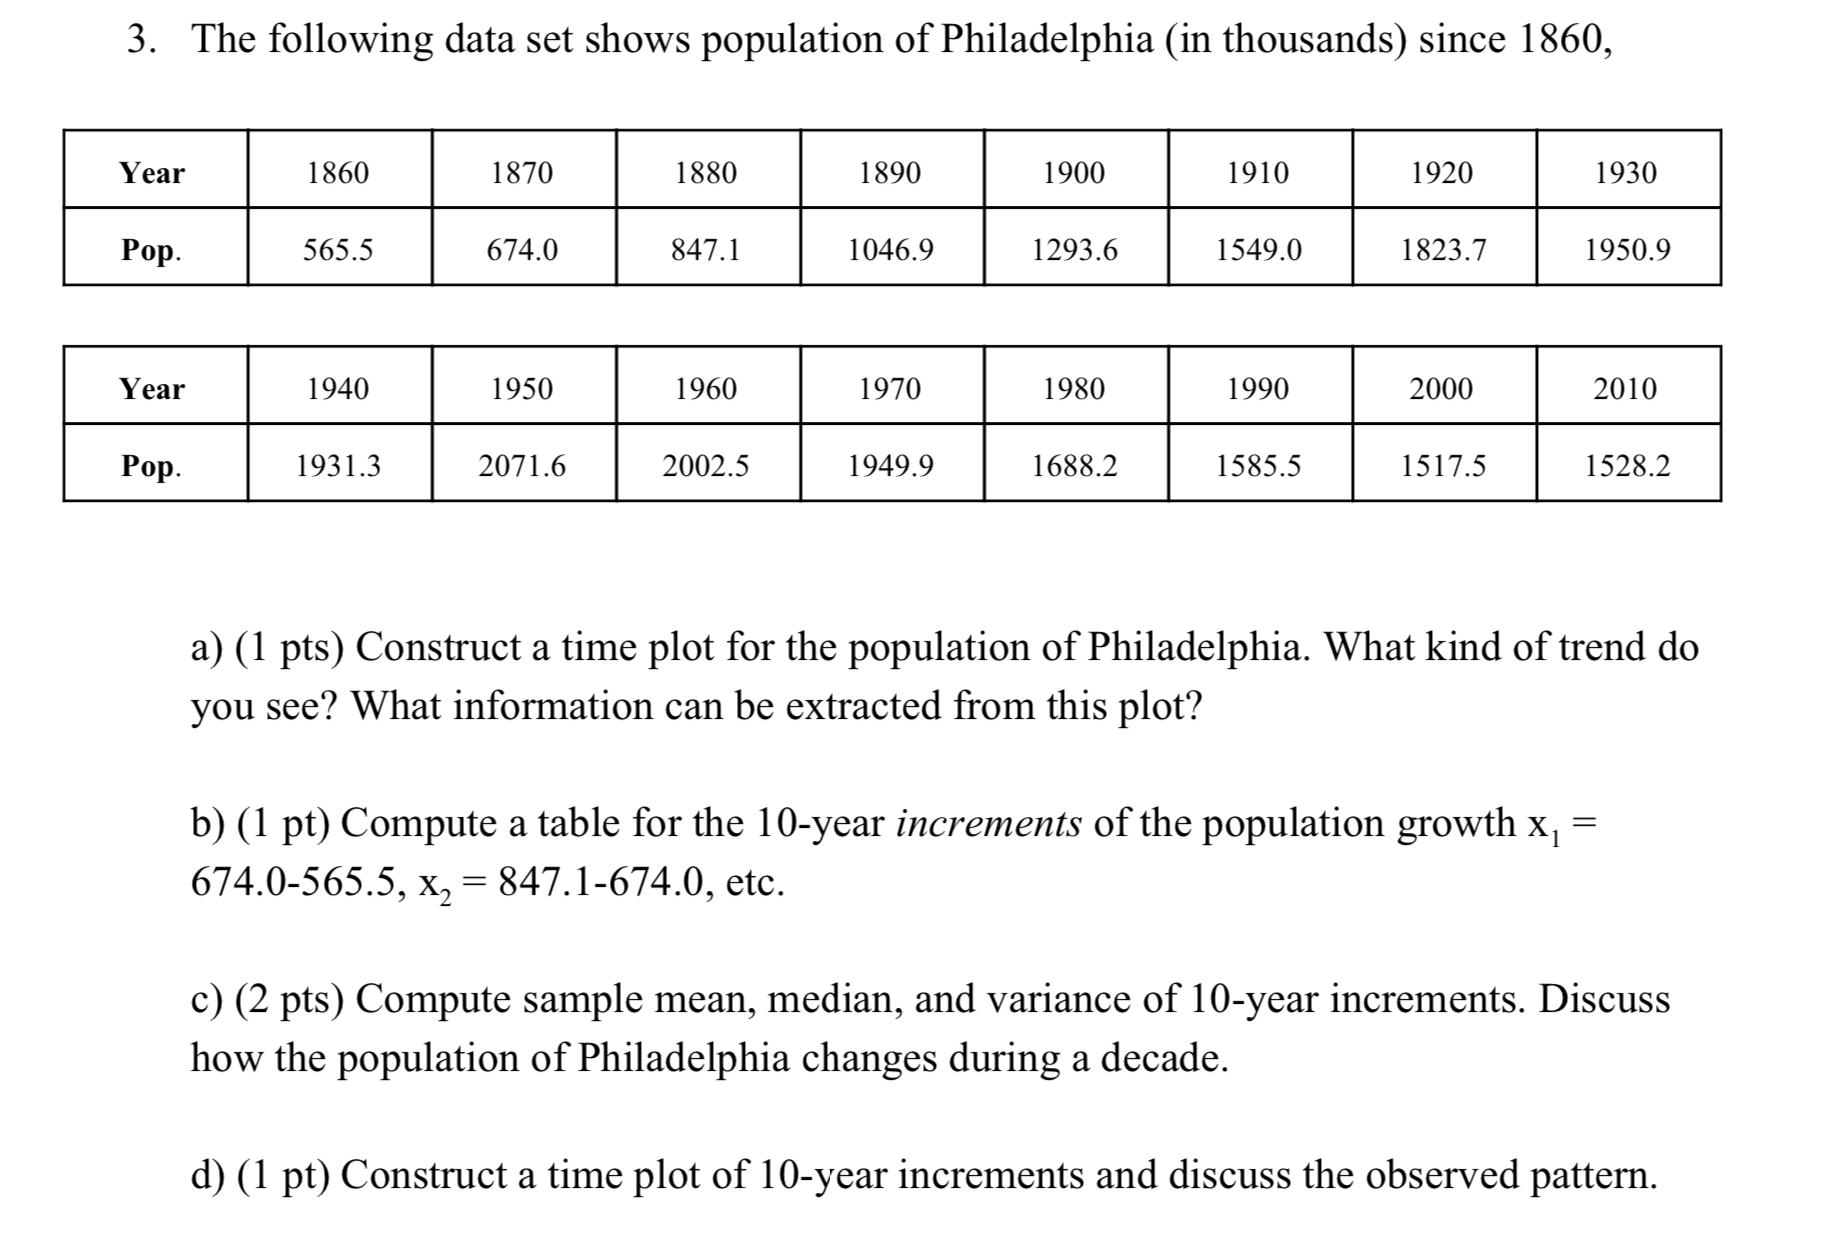
please help 3. The following data set shows population of Philadelphia (in thousands) since 1860, 1860 1880 1890 1900 1910 1920 1930 565.5 674.0

please help

image text in transcribed
3. The following data set shows population of Philadelphia (in thousands) since 1860, 1860 1880 1890 1900 1910 1920 1930 \" 565.5 674.0 847.1 1046.9 1293.6 1549.0 1823.7 1950.9 1940 1950 1960 1970 1980 1990 2000 2010 \" 1931.3 2071.6 2002.5 1949.9 1688.2 1585.5 1517.5 1528.2 a) (1 pts) Construct a time plot for the population of Philadelphia. What kind of trend do you see? What information can be extracted from this plot? b) (1 pt) Compute a table for the 10year increments of the population growth x1 = 674.0565.5, x2 = 847.1674.0, etc. 0) (2 pts) Compute sample mean, median, and variance of 10year increments. Discuss how the population of Philadelphia changes during a decade. d) (1 pt) Construct a time plot of 10year increments and discuss the observed pattern

Step by Step Solution

There are 3 Steps involved in it

Step: 1

blur-text-image

Get Instant Access to Expert-Tailored Solutions

See step-by-step solutions with expert insights and AI powered tools for academic success

Step: 2

blur-text-image

Step: 3

blur-text-image

Ace Your Homework with AI

Get the answers you need in no time with our AI-driven, step-by-step assistance

Get Started

Recommended Textbook for

Prealgebra

Authors: Elayn Martin Gay

7th edition

321955048, 978-0321955043

More Books

Students also viewed these Mathematics questions

Question

How buffering can improve performance of a computer system

Answered: 1 week ago

Question

Write the importance of mitochondria in a cell?

Answered: 1 week ago

Question

The cellular structure it synthesis the respiratory enzymes?

Answered: 1 week ago

Question

It is made up of lipoprotein?

Answered: 1 week ago