Please help
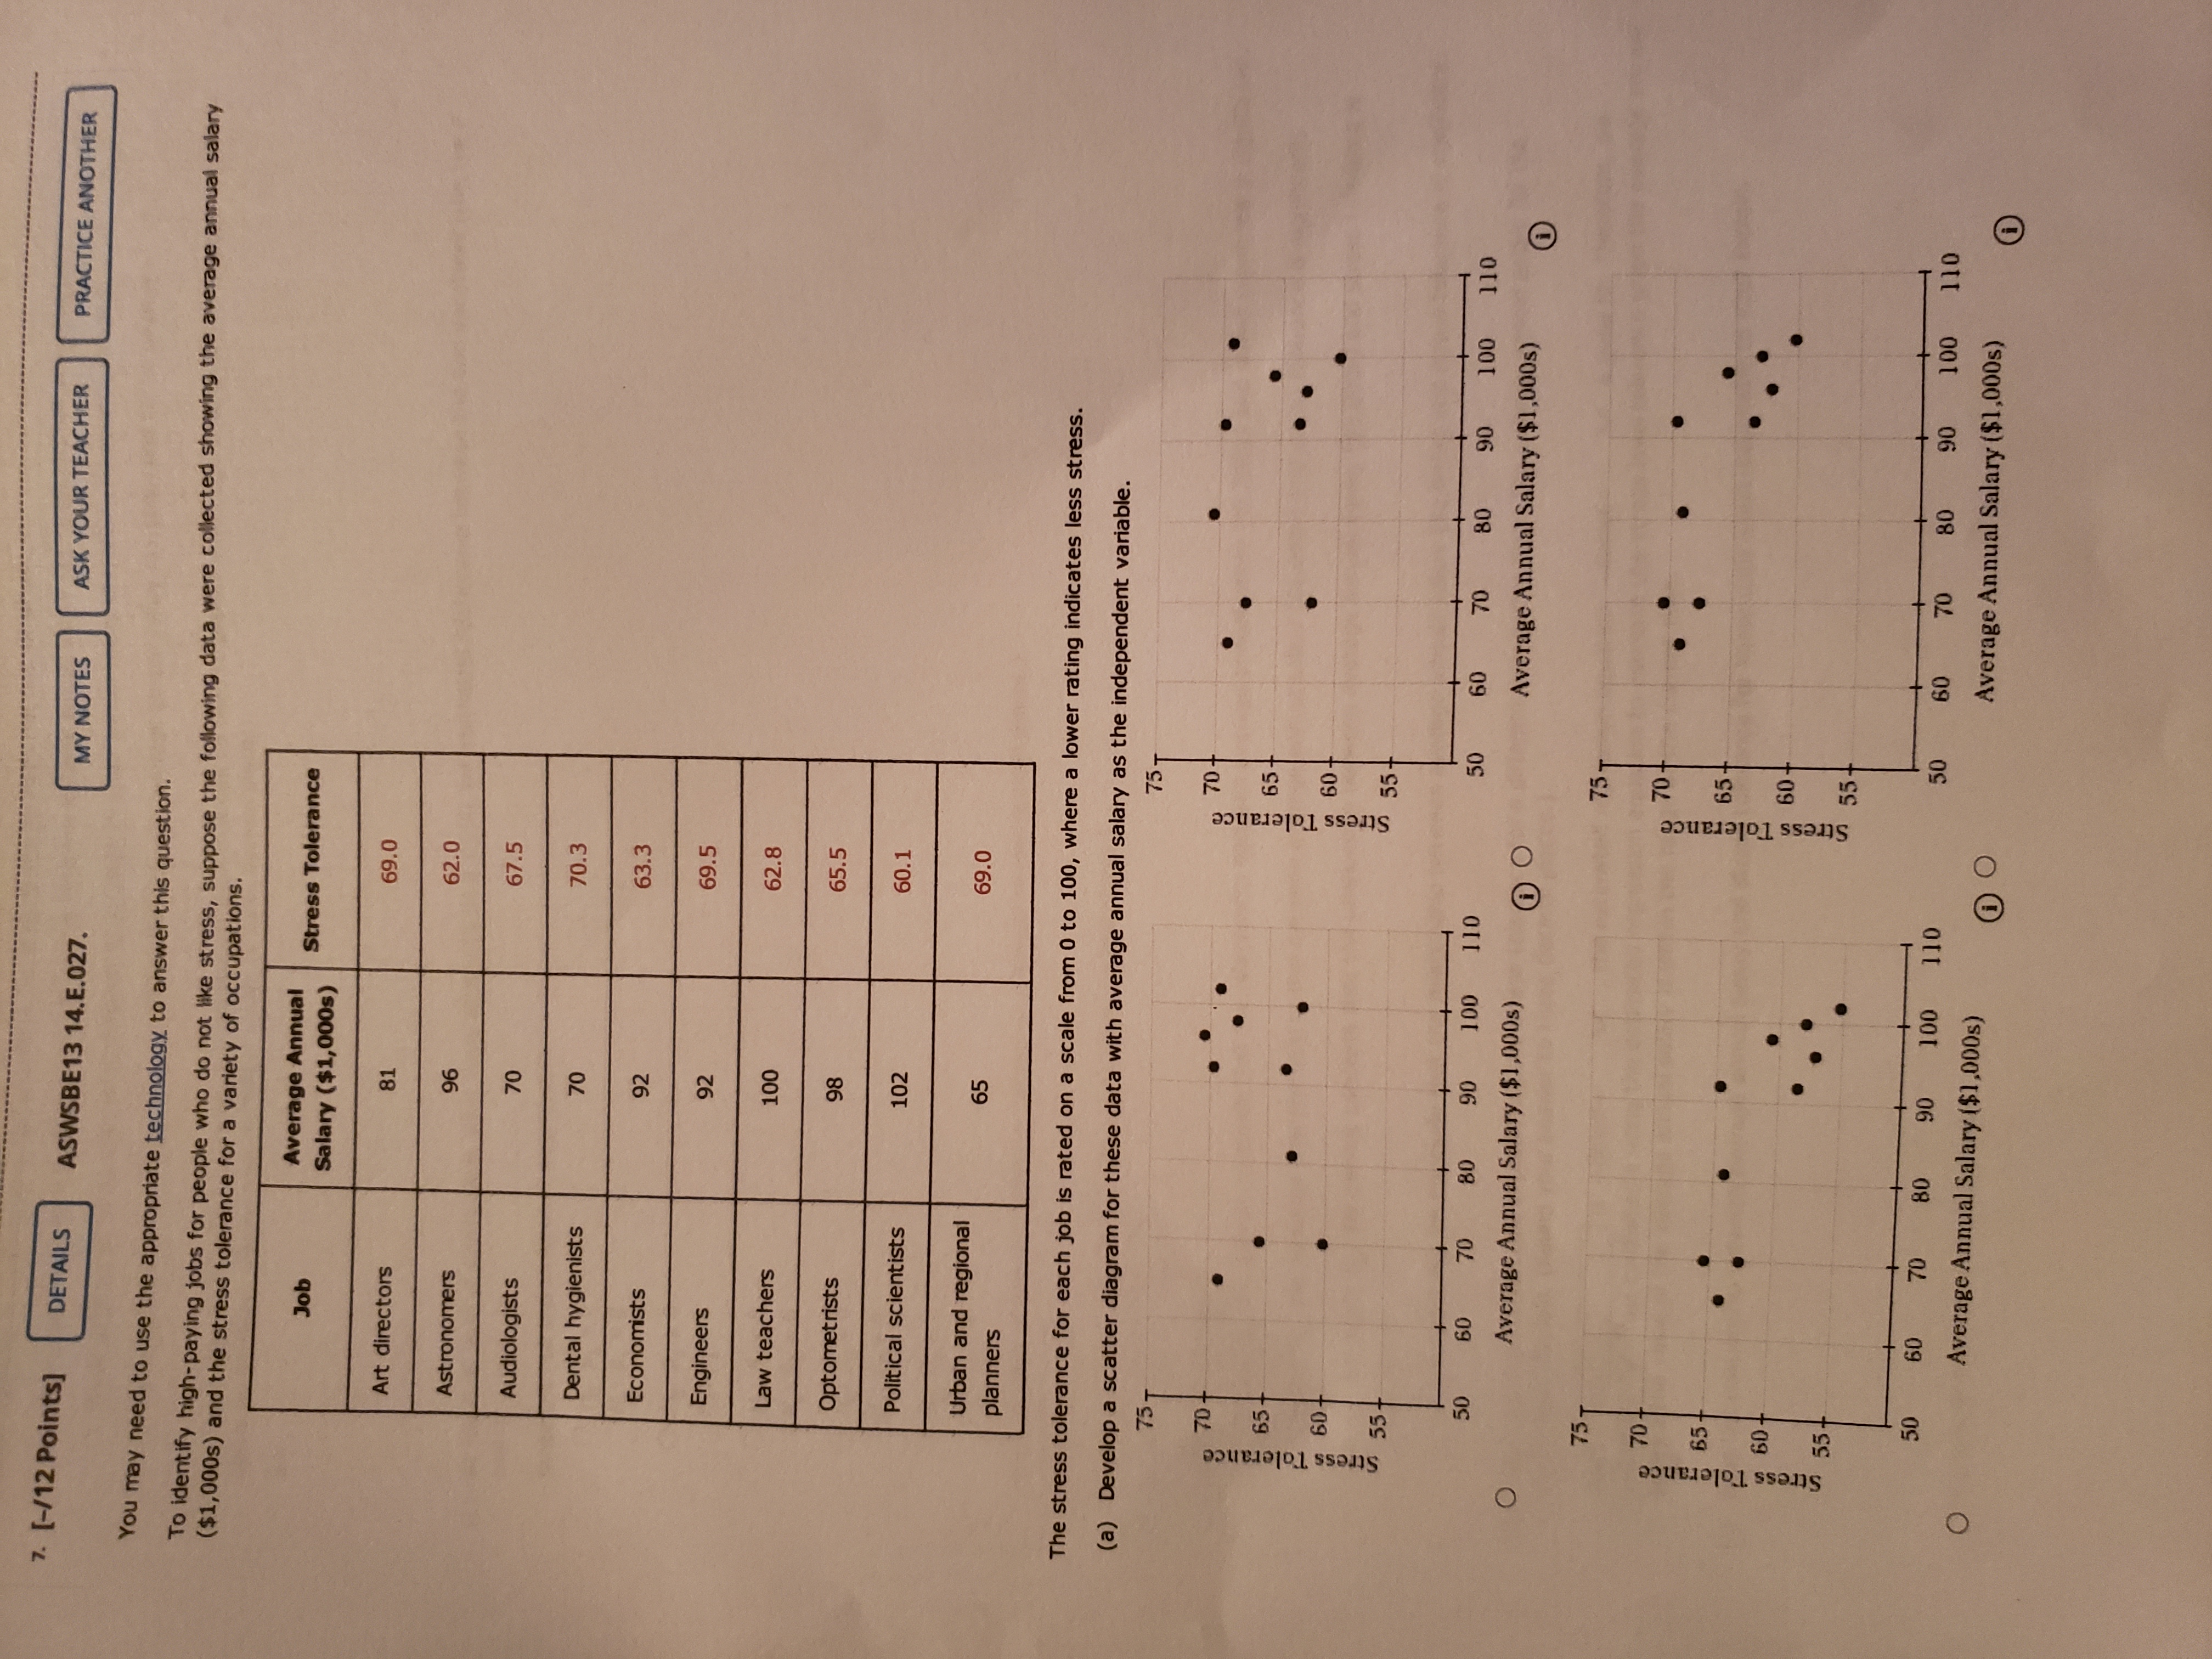
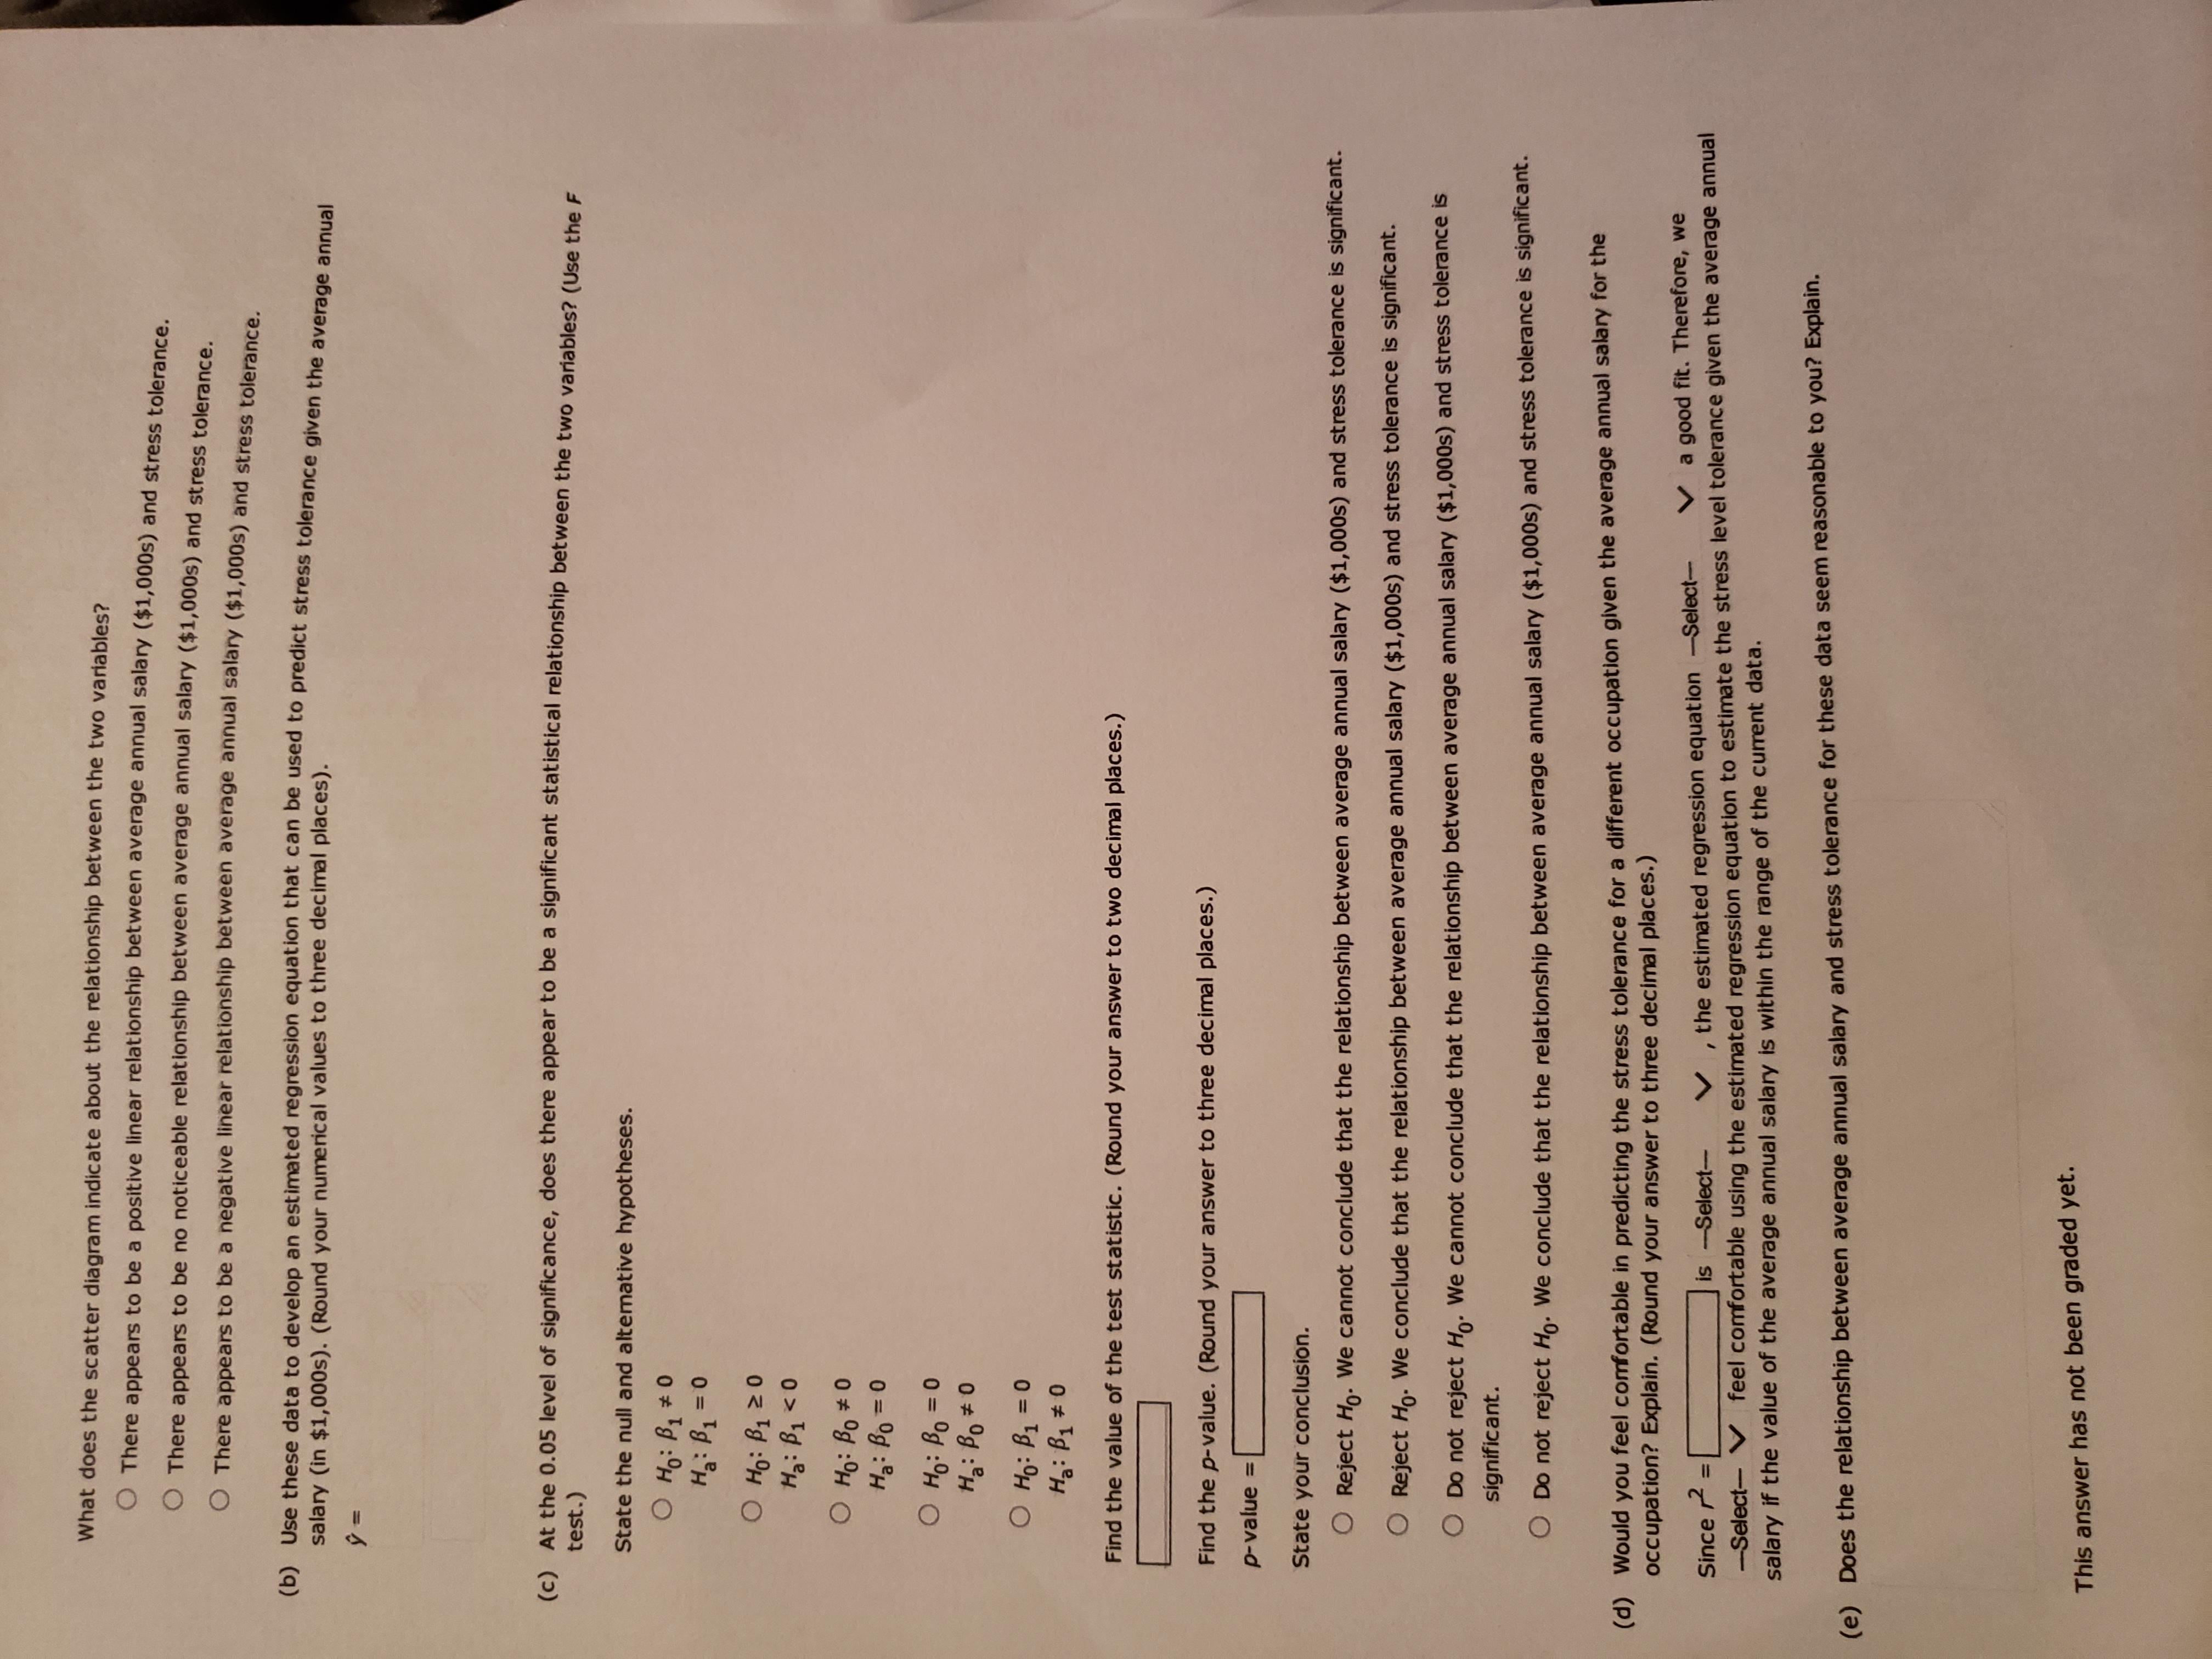
7. [-/12 Points] DETAILS ASWSBE13 14.E.027. MY NOTES ASK YOUR TEACHER PRACTICE ANOTHER You may need to use the appropriate technology to answer this question. To identify high-paying jobs for people who do not like stress, suppose the following data were collected showing the average annual salary ($1,000s) and the stress tolerance for a variety of occupations. Job Average Annual Salary ($1,000s) Stress Tolerance Art directors 81 69.0 Astronomers 96 62.0 Audiologists 70 67.5 Dental hygienists 70 70.3 Economists 92 63.3 Engineers 92 69.5 Law teachers 100 62.8 Optometrists 98 65.5 Political scientists 102 60.1 Urban and regional 65 69.0 planners The stress tolerance for each job is rated on a scale from 0 to 100, where a lower rating indicates less stress. (a) Develop a scatter diagram for these data with average annual salary as the independent variable. 75- 75 - Stress Tolerance 70. 65 SD- 55 Stress Tolerance 70 55- 60 - 55 - 50 50 70 80 90 100 110 50 60 70 80 90 100 110 O Average Annual Salary ($1,000s) Average Annual Salary ($1,000s) 75 75 Stress Tolerance 70 70 - 65- 35 50- 55 Stress Tolerance 55 50 60 70 80 90 100 110 50 70 80 90 100 110 O Average Annual Salary ($1,000s) Average Annual Salary ($1,000s)What does the scatter diagram indicate about the relationship between the two variables? There appears to be a positive linear relationship between average annual salary ($1,000s) and stress tolerance. There appears to be no noticeable relationship between average annual salary ($1,000s) and stress tolerance. There appears to be a negative linear relationship between average annual salary ($1,000s) and stress tolerance. (b) Use these data to develop an estimated regression equation that can be used to predict stress tolerance given the average annual salary (in $1,000s). (Round your numerical values to three decimal places). y = (c) At the 0.05 level of significance, does there appear to be a significant statistical relationship between the two variables? (Use the F test.) State the null and alternative hypotheses. O Ho : B 1 0 Ha : B1 = 0 O Ho : B 1 20 Ha : B1