

Answered step by step
Verified Expert Solution
Question
1 Approved Answer
please help A B 1 Cost Volume Profit Analysis for Strata Bikes 2 3 4. Product Name Strata 5 Unit Sales Price $ 4,215.00 6
please help
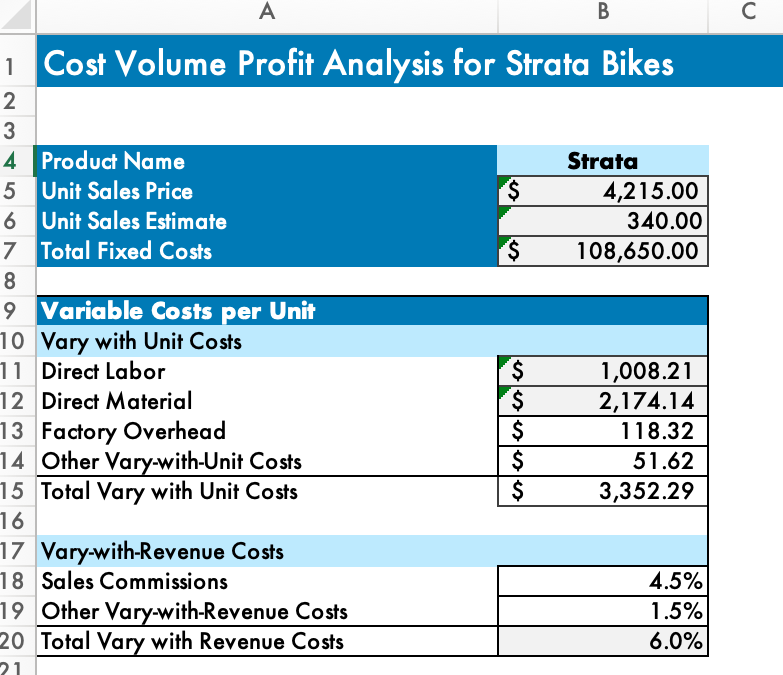
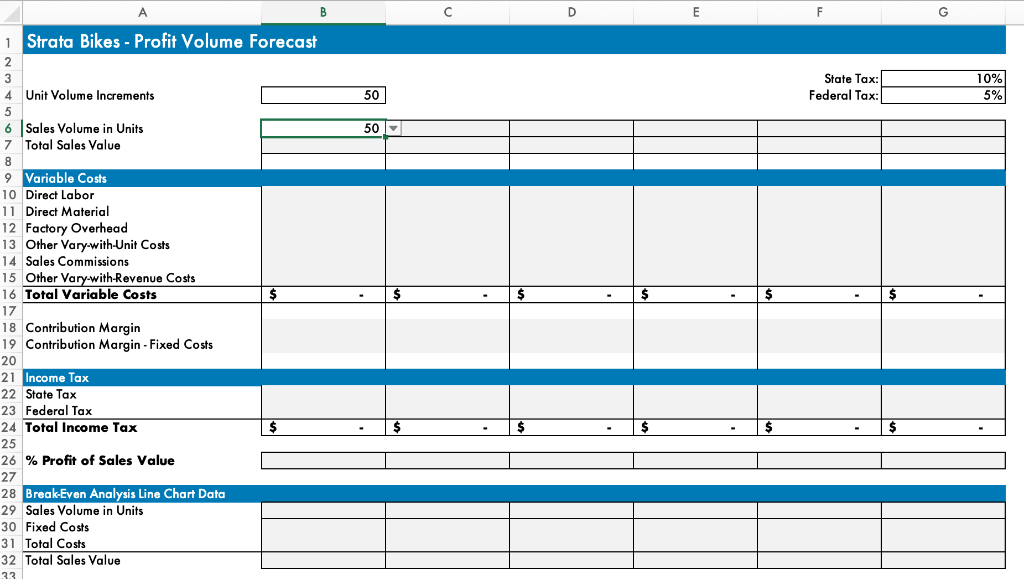
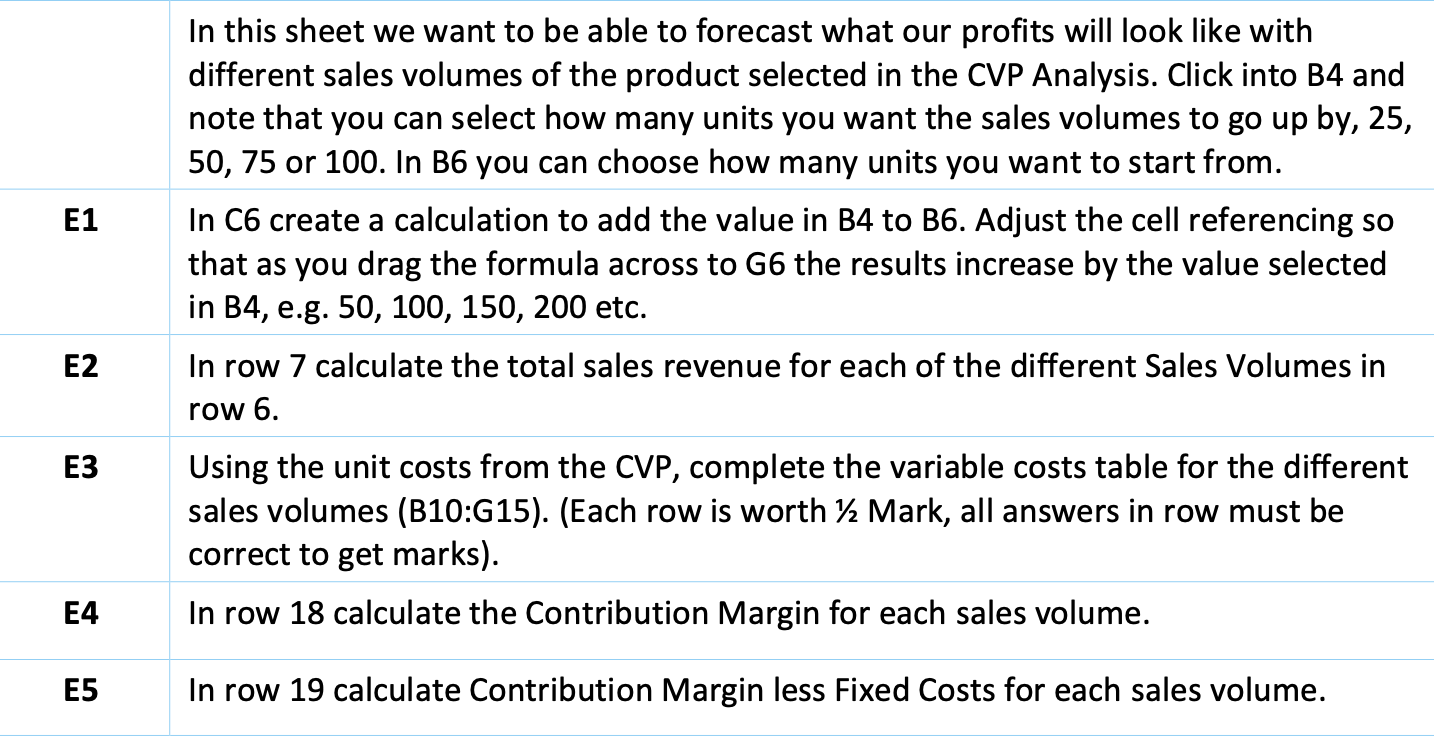
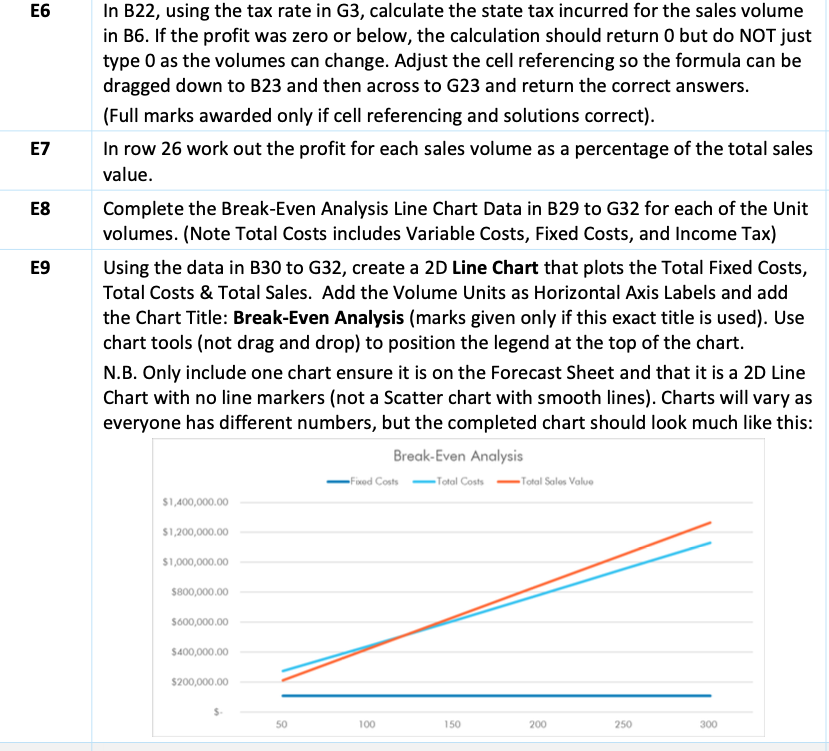
A B 1 Cost Volume Profit Analysis for Strata Bikes 2 3 4. Product Name Strata 5 Unit Sales Price $ 4,215.00 6 Unit Sales Estimate 340.00 7 Total Fixed Costs $ 108,650.00 8 9 Variable Costs per Unit 10 Vary with Unit Costs 11 Direct Labor $ 1,008.21 12 Direct Material $ 2,174.14 13 Factory Overhead $ 118.32 14 Other Vary-with-Unit Costs $ 51.62 15 Total Vary with Unit Costs $ 3,352.29 16 17 Vary-with-Revenue Costs 18 Sales Commissions 4.5% 19 Other Vary-with-Revenue Costs 1.5% 20 Total Vary with Revenue Costs 6.0% ie 21 G 1 Strata Bikes - Profit Volume Forecast 2 3 4 Unit Volume Increments State Tax: Federal Tax: 10% 5% 50 50 - 6 Sales Volume in Units ? 7 Total Sales Value 8 9 Variable Costs 10 Direct Labor 11 Direct Material 12 Factory Overhead 13 Other Vary-with-Unit Costs 14 Sales Commissions 15 Other Vary-with-Revenue Costs 16 Total Variable Costs 17 18 Contribution Margin 19 Contribution Margin - Fixed Costs 20 21 Income Tax 22 State Tax 23 Federal Tax 24 Total Income Tax 25 26 % Profit of Sales Value 27 28 Break-Even Analysis Line Chart Data 29 Sales Volume in Units 30 Fixed Costs 31 Total Costs 32 Total Sales Value 33 $ $ $ E1 In this sheet we want to be able to forecast what our profits will look like with different sales volumes of the product selected in the CVP Analysis. Click into B4 and note that you can select how many units you want the sales volumes to go up by, 25, 50, 75 or 100. In B6 you can choose how many units you want to start from. In C6 create a calculation to add the value in B4 to B6. Adjust the cell referencing so that as you drag the formula across to G6 the results increase by the value selected in B4, e.g. 50, 100, 150, 200 etc. In row 7 calculate the total sales revenue for each of the different Sales Volumes in row 6. E2 E3 1 Using the unit costs from the CVP, complete the variable costs table for the different sales volumes (B10:G15). (Each row is worth 22 Mark, all answers in row must be correct to get marks). In row 18 calculate the Contribution Margin for each sales volume. E4 E5 In row 19 calculate Contribution Margin less Fixed Costs for each sales volume. E6 E7 ES E9 In B22, using the tax rate in G3, calculate the state tax incurred for the sales volume in B6. If the profit was zero or below, the calculation should return 0 but do NOT just type 0 as the volumes can change. Adjust the cell referencing so the formula can be dragged down to B23 and then across to G23 and return the correct answers. (Full marks awarded only if cell referencing and solutions correct). In row 26 work out the profit for each sales volume as a percentage of the total sales value. Complete the Break-Even Analysis Line Chart Data in B29 to G32 for each of the Unit volumes. (Note Total Costs includes Variable Costs, Fixed Costs, and Income Tax) Using the data in B30 to G32, create a 2D Line Chart that plots the Total Fixed Costs, Total Costs & Total Sales. Add the Volume Units as Horizontal Axis Labels and add the Chart Title: Break-Even Analysis (marks given only if this exact title is used). Use chart tools (not drag and drop) to position the legend at the top of the chart. N.B. Only include one chart ensure it is on the Forecast Sheet and that it is a 2D Line Chart with no line markers (not a Scatter chart with smooth lines). Charts will vary as everyone has different numbers, but the completed chart should look much like this: Break-Even Analysis Fixed Costs Total Costs Total Sales Value $1,400,000.00 $1,200,000.00 $1,000,000.00 $800,000.00 5600,000.00 $400,000.00 $200,000.00 50 100 150 200 250 300Step by Step Solution
There are 3 Steps involved in it
Step: 1

Get Instant Access to Expert-Tailored Solutions
See step-by-step solutions with expert insights and AI powered tools for academic success
Step: 2

Step: 3
Ace Your Homework with AI
Get the answers you need in no time with our AI-driven, step-by-step assistance
Get Started
Low Income Housing Tax Credit IRS Audit Techniques Guide
Authors: Internal Revenue Service
1st Edition
978-1304135087