PLease help
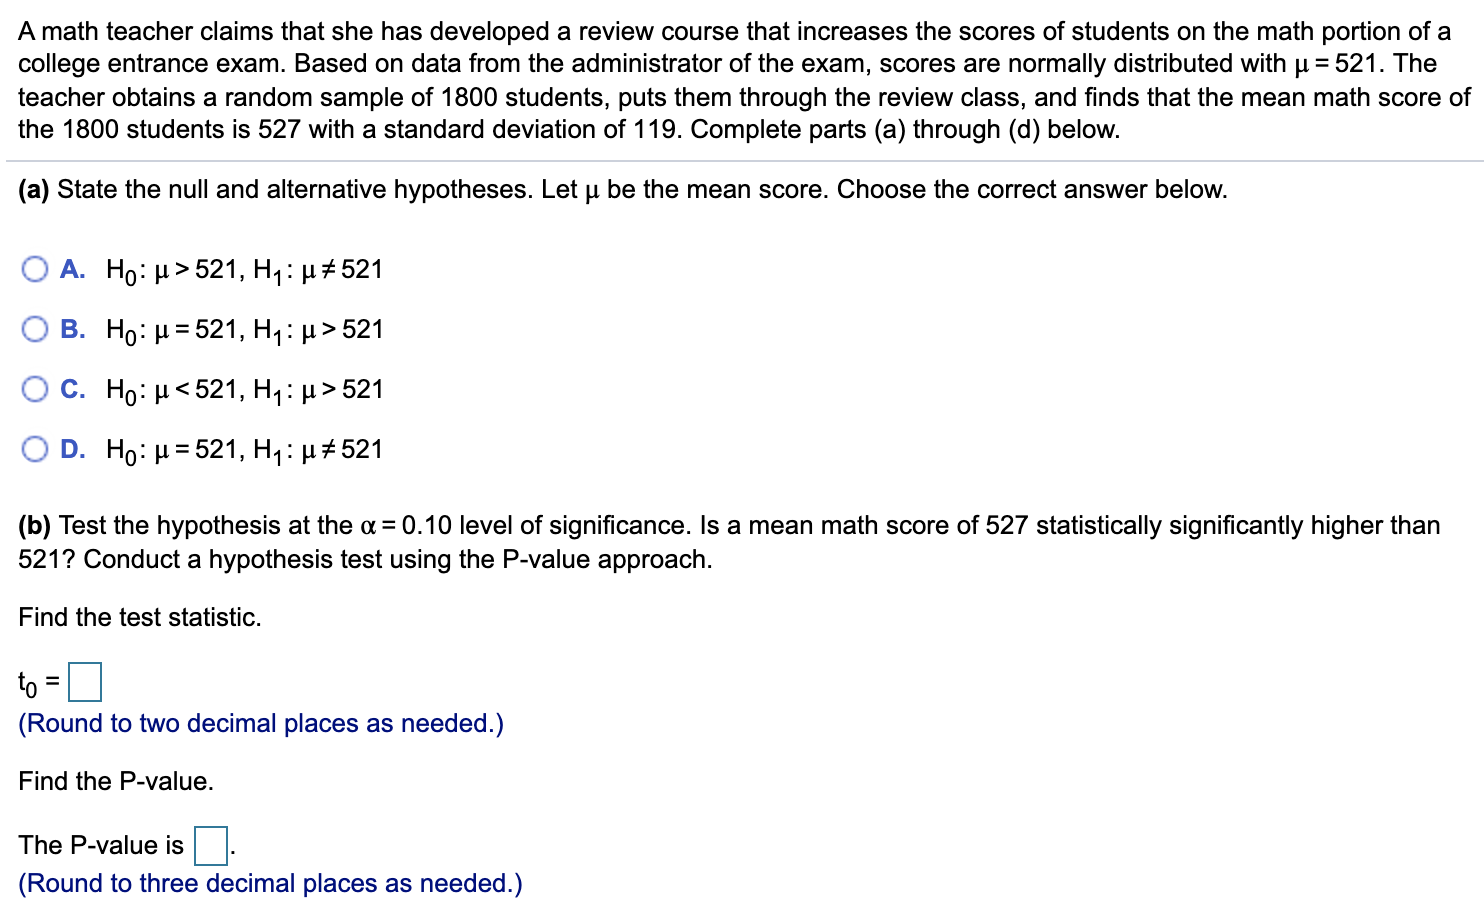
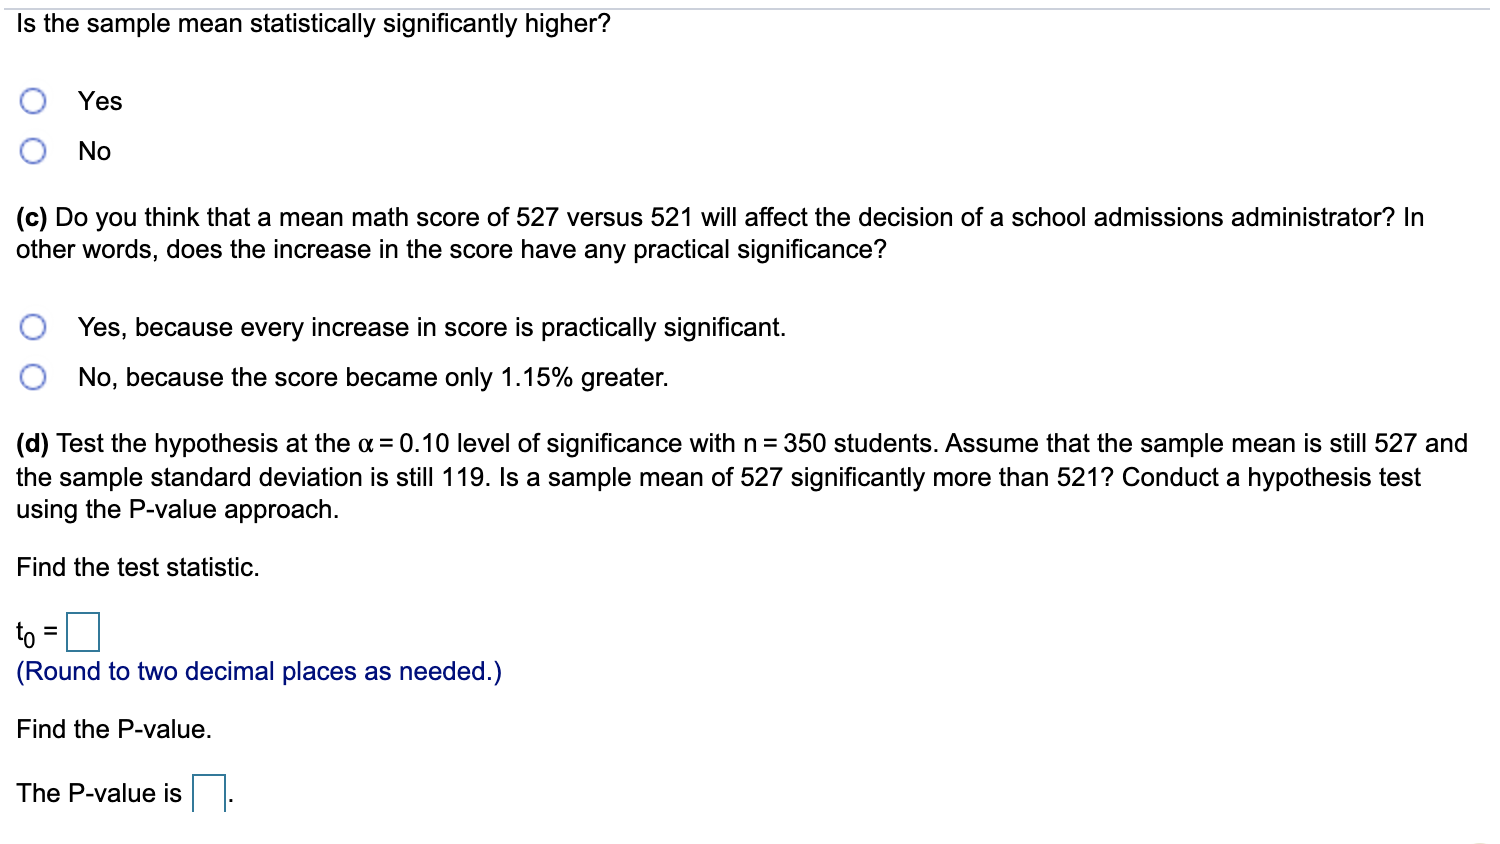
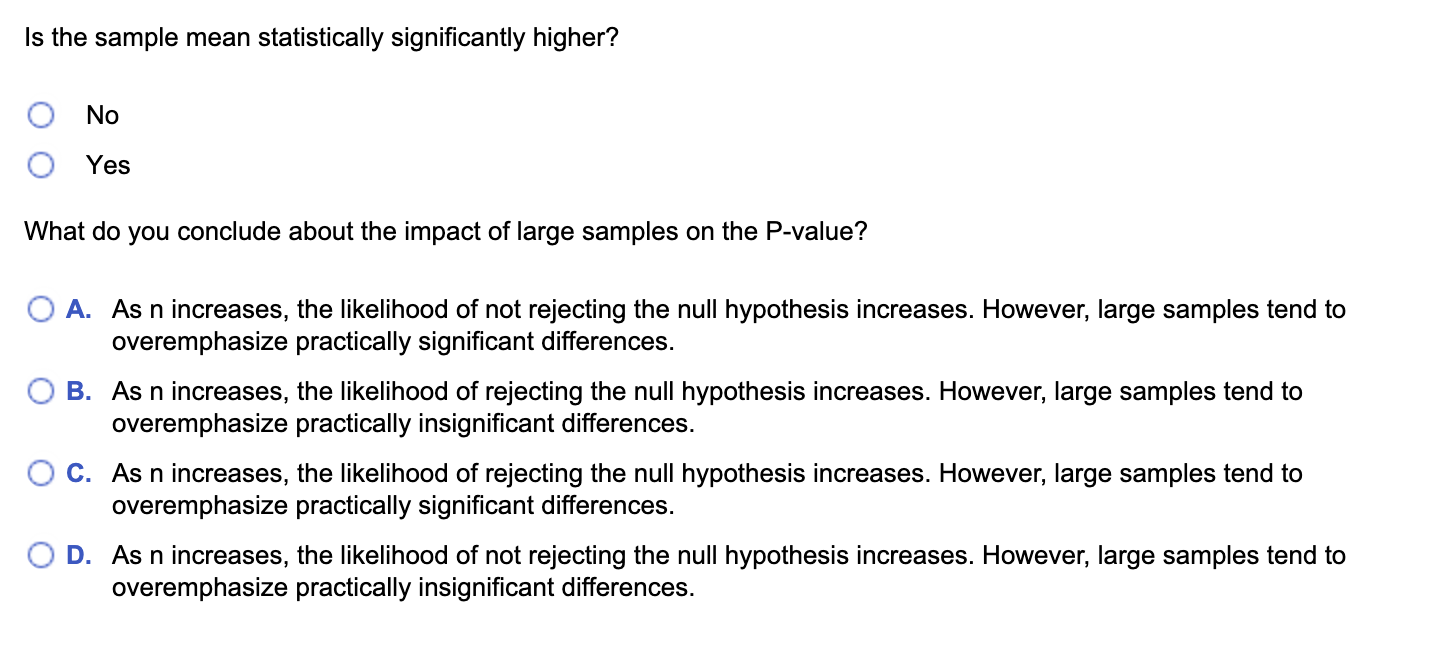
A math teacher claims that she has developed a review course that increases the scores of students on the math portion of a college entrance exam. Based on data from the administrator of the exam, scores are normally distributed with u = 521. The teacher obtains a random sample of 1800 students, puts them through the review class, and nds that the mean math score of the 1800 students is 527 with a standard deviation of 119. Complete parts (a) through (d) below. (a) State the null and alternative hypotheses. Let p. be the mean score. Choose the correct answer below. 0 A. Ho: u>521, H1: (\"5521 O B. Ho: p=521, H1: p>521 O 0. HO: p521 O 0. Ho: (1:521, H1: (\"5521 (b) Test the hypothesis at the a = 0.10 level of signicance. Is a mean math score of 527 statistically signicantly higher than 521? Conduct a hypothesis test using the Pvalue approach. Find the test statistic. t0 = D (Round to two decimal places as needed.) Find the P-value. The P-value is D. (Round to three decimal places as needed.) Is the sample mean statistically significantly higher? O Yes O No (c) Do you think that a mean math score of 527 versus 521 will affect the decision of a school admissions administrator? In other words, does the increase in the score have any practical significance? O Yes, because every increase in score is practically significant. O No, because the score became only 1.15% greater. (d) Test the hypothesis at the a = 0.10 level of significance with n = 350 students. Assume that the sample mean is still 527 and the sample standard deviation is still 119. Is a sample mean of 527 significantly more than 521? Conduct a hypothesis test using the P-value approach. Find the test statistic. to = (Round to two decimal places as needed.) Find the P-value. The P-value isIs the sample mean statistically significantly higher? O No O Yes What do you conclude about the impact of large samples on the P-value? O A. As n increases, the likelihood of not rejecting the null hypothesis increases. However, large samples tend to overemphasize practically significant differences. O B. As n increases, the likelihood of rejecting the null hypothesis increases. However, large samples tend to overemphasize practically insignificant differences. O C. As n increases, the likelihood of rejecting the null hypothesis increases. However, large samples tend to overemphasize practically significant differences. O D. As n increases, the likelihood of not rejecting the null hypothesis increases. However, large samples tend to overemphasize practically insignificant differences