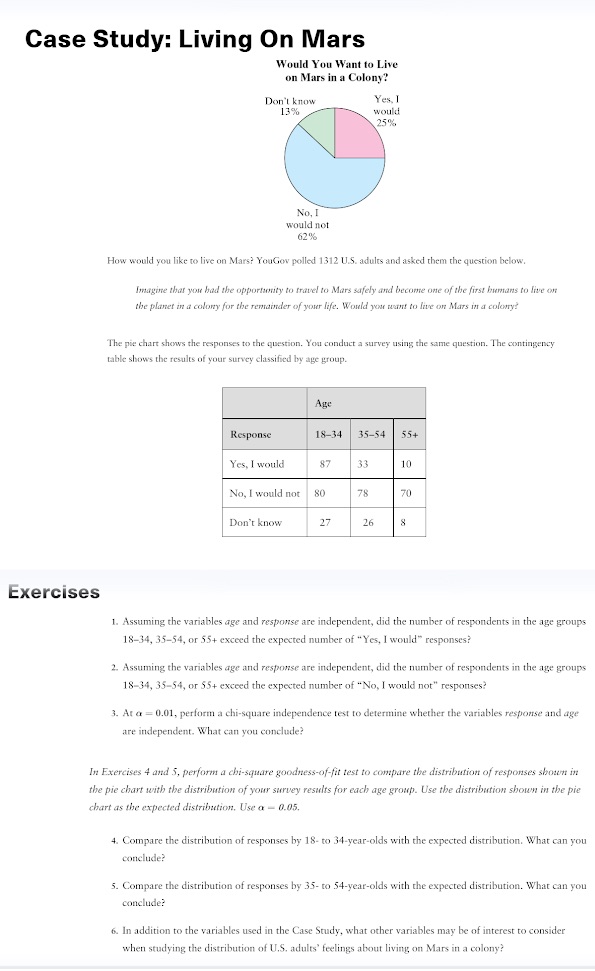
Please help and Explain
Case Study: Living On Mars Would You Want to Live on Mars in a Colony? Don't know Yes, I 13% would 25%% No, I would not 62% How would you like to live on Mars? YouGov polled 1312 U.S. adults and asked them the question below. Imagine that you had the opportunity to travel to Mars safely and become one of the first humans to live on the planet in a colony for the remainder of your life. Would you want to live on Mars in a colorry? The pie chart shows the responses to the question. You conduct a survey using the same question. The contingency table shows the results of your survey classified by age group. Response 18-34 35-54 55+ Yes, I would 87 3.3 No, I would not 80 78 70 Don't know 27 26 Exercises 1. Assuming the variables age and response are independent, did the number of respondents in the age groups 18-34, 35-54, or 55+ exceed the expected number of "Yes, I would" responses? 2. Assuming the variables age and response are independent, did the number of respondents in the age groups 18-34, 35-54, or 55+ exceed the expected number of "No, I would not" responses? 3. At a = 0.01, perform a chi-square independence test to determine whether the variables response and age are independent. What can you conclude? In Exercises 4 and 5, perform a chi-square goodness-of fit test to compare the distribution of responses shown in the pie chart with the distribution of your survey results for each age group. Use the distribution shown in the pie chart as the expected distribution, Use a - 0.05. 4. Compare the distribution of responses by 18- to 34-year-olds with the expected distribution. What can you conclude? 5. Compare the distribution of responses by 35-to 54-year-olds with the expected distribution. What can you conclude? 6. In addition to the variables used in the Case Study, what other variables may be of interest to consider when studying the distribution of U.S. adults' feelings about living on Mars in a colony