Please help and included ALL steps! Everything is already solved! Just need the step-by-step!! I'll leave a good review if you make it easy to
Please help and included ALL steps! Everything is already solved! Just need the step-by-step!! I'll leave a good review if you make it easy to read and include all the steps!
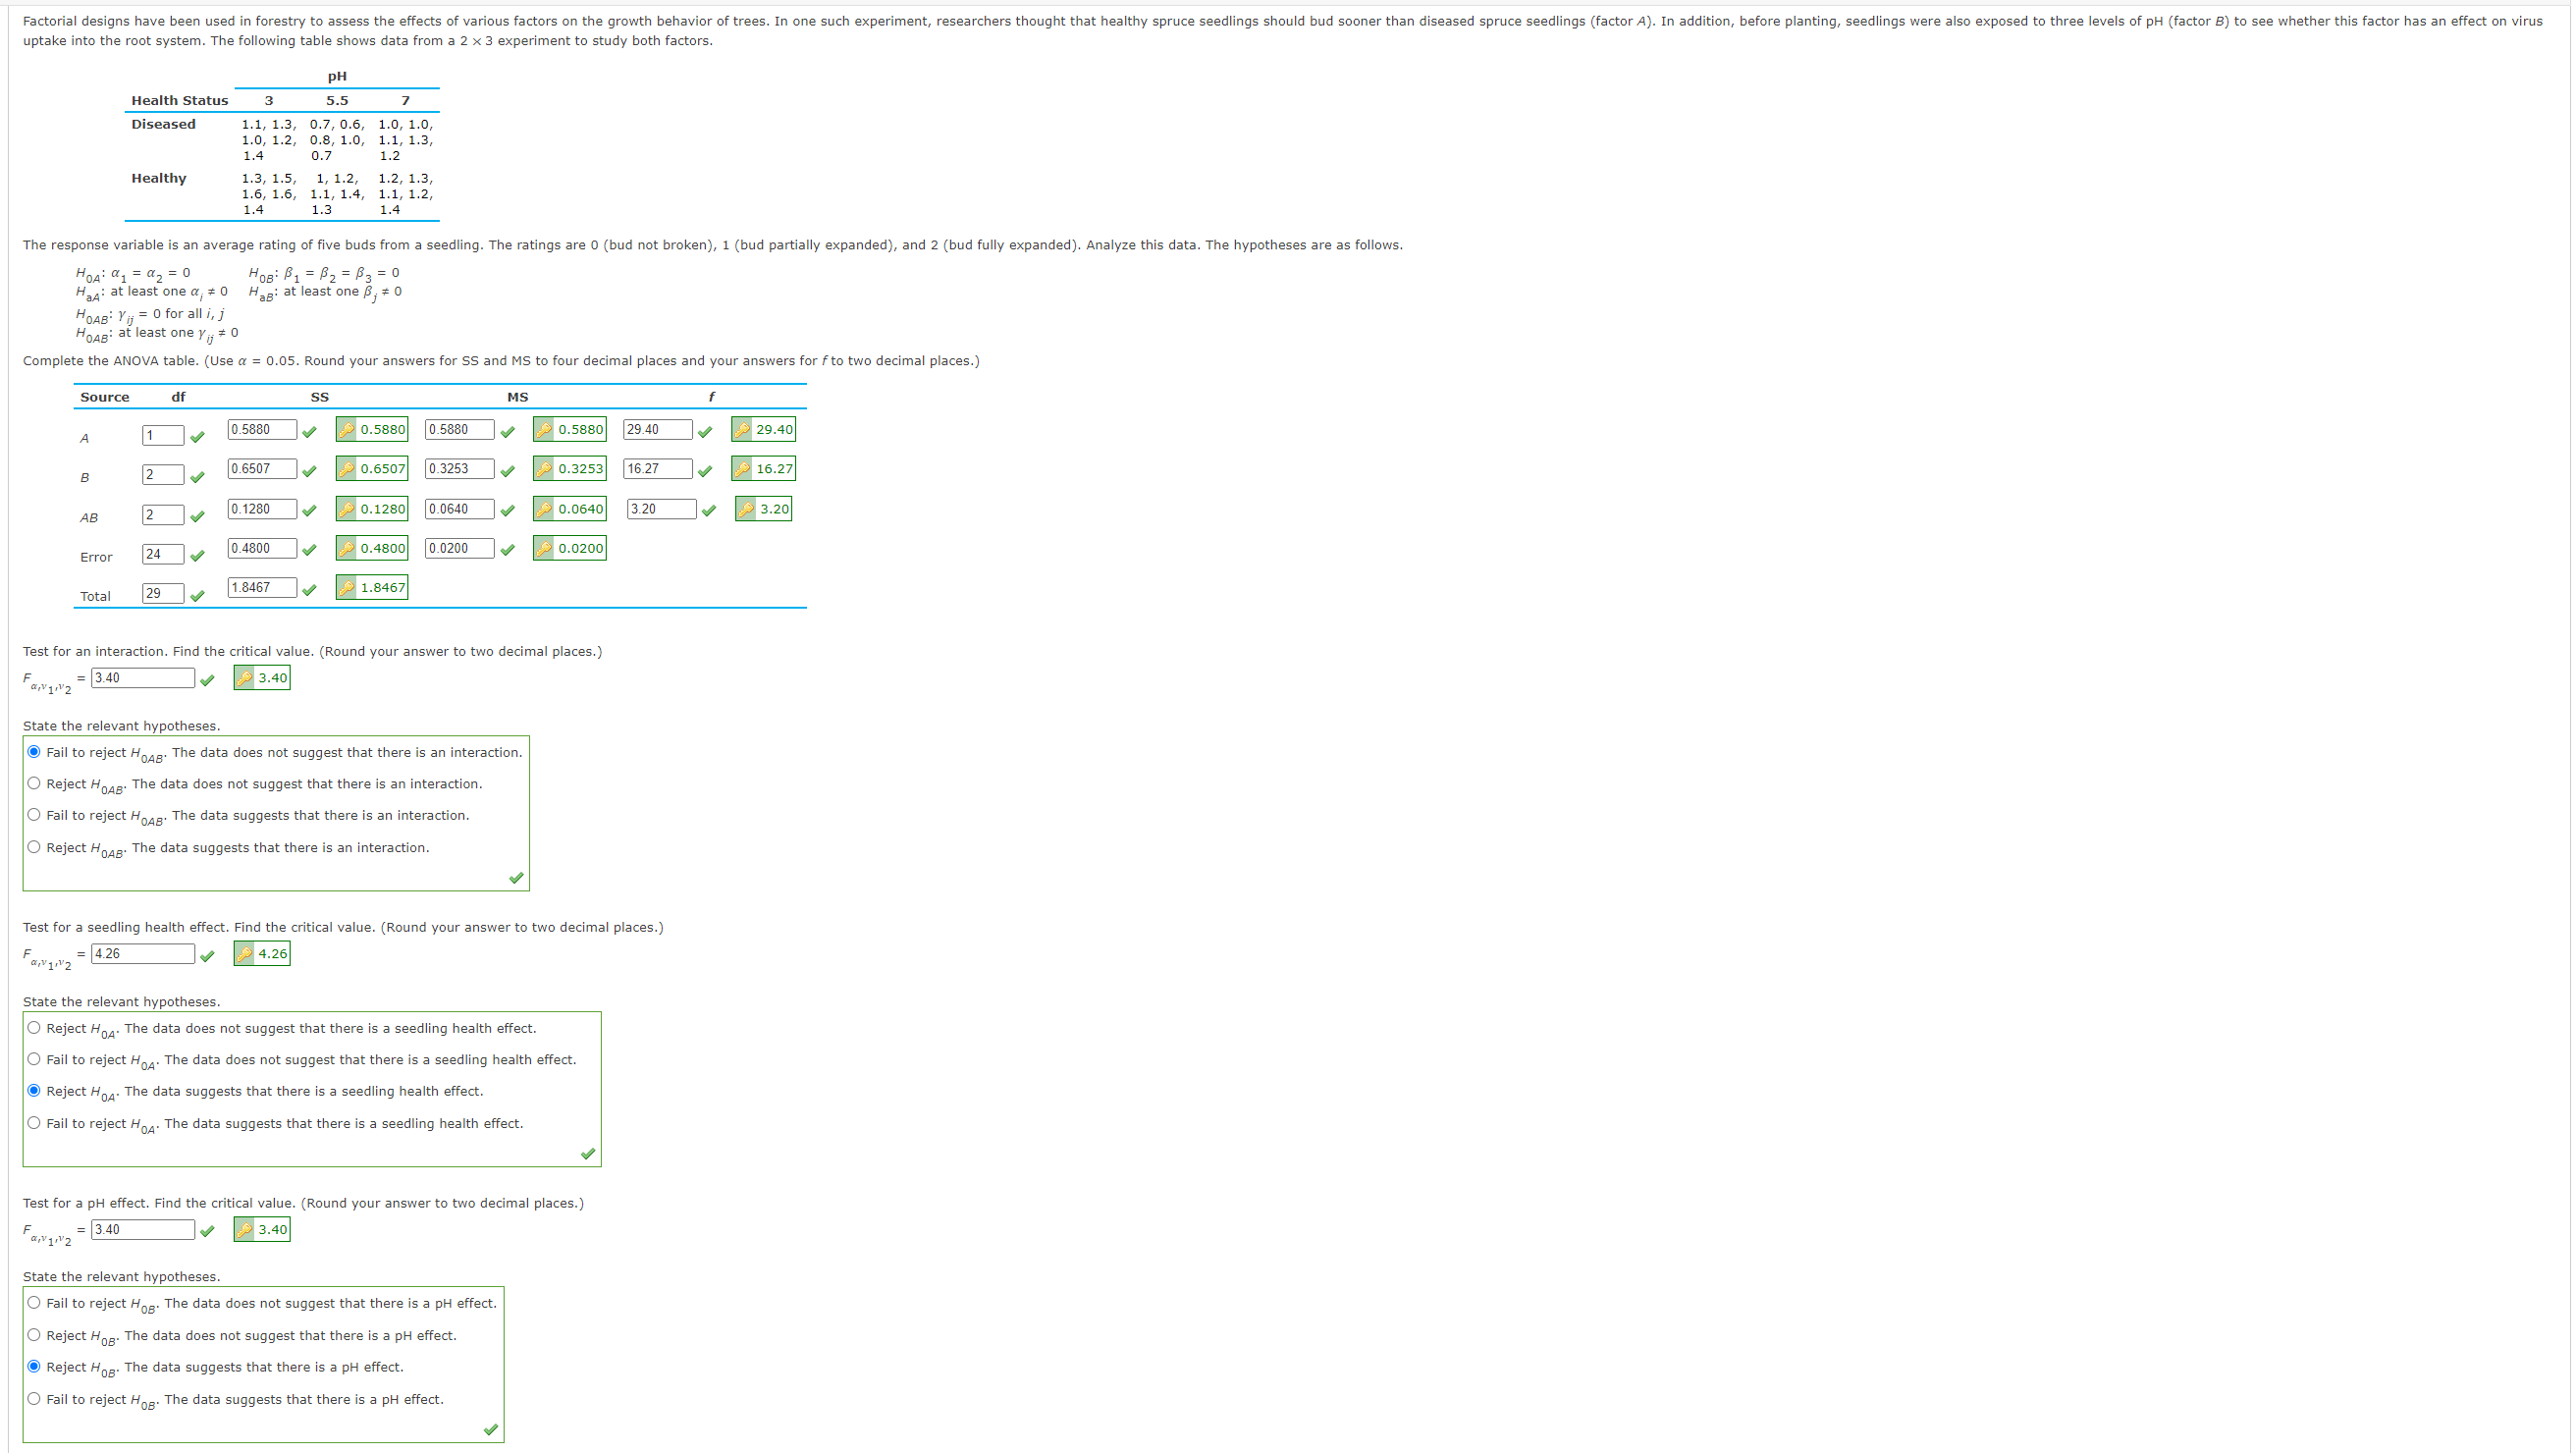
Factorial designs have been used in forestry to assess the effects of various factors on the growth behavior of trees. In one such experiment, researchers thought that healthy spruce s diseased spruce seedlings (factor A). In addition, before planting, seedlings were also exposed to three levels of pH (factor B) to see whether this factor has an effect on virus uptake into the root system. The following table shows data from a 2 x 3 experiment to study both factors. PH Health Status 3 5.5 Diseased 1.1, 1.3, 0.7, 0.6, 1.0, 1.0, 1.0, 1.2, 0.8, 1.0, 1.1, 1.3, 1.4 0.7 1.2 Healthy 1.3, 1.5, 1, 1.2, 1.2, 1.3 1.6, 1.6, 1.1, 1.4, 1.1, 1.2 1.4 1.3 14 The response variable is an average rating of five buds from a seedling. The ratings are 0 (bud not broken), 1 (bud partially expanded), and 2 (bud fully expanded). Analyze this data. The hypotheses are as follows. HOA: a1 = a2 = 0 HOB: B1 = P2 = B3 = 0 HaA: at least one a, # 0 Hag: at least one B, # 0 HOAB: YH; = 0 for all i, j HOAB: at least one y;; # 0 Complete the ANOVA table. (Use a = 0.05. Round your answers for SS and MS to four decimal places and your answers for f to two decimal places.) Source df SS MS 1 0.5880 0.5880 0.5880 0.5880 29.40 29.40 B 2 0.6507 0.6507 0.3253 0.3253 16.27 16.27 AB 0.1280 0.1280 0.0640 0.0640 3.20 3.20 Error 24 0.4800 0.4800 0.0200 0.0200 Total 29 1.8467 1.8467 Test for an interaction. Find the critical value. (Round your answer to two decimal places.) Fa,12 = 3.40 3.40 State the relevant hypotheses. Fail to reject HOAB. The data does not suggest that there is an interaction. O Reject HOAB. The data does not suggest that there is an interaction. O Fail to reject HOAB. The data suggests that there is an interaction. O Reject HOAB. The data suggests that there is an interaction. Test for a seedling health effect. Find the critical value. (Round your answer to two decimal places.) Fa,viv2 = 4.26 4.26 State the relevant hypotheses O Reject HoA. The data does not suggest that there is a seedling health effect O Fail to reject HOA. The data does not suggest that there is a seedling health effect. Reject HoA. The data suggests that there is a seedling health effect. O Fail to reject HoA. The data suggests that there is a seedling health effect. Test for a PH effect. Find the critical value. (Round your answer to two decimal places.) = 3.40 Fa,v 11 2 1 3.40 State the relevant hypotheses. O Fail to reject Hog. The data does not suggest that there is a pH effect. O Reject Hog. The data does not suggest that there is a pH effect. Reject Hog. The data suggests that there is a pH effect. O Fail to reject Hop. The data suggests that there is a pH effect
Step by Step Solution
There are 3 Steps involved in it
Step: 1
Get Instant Access to Expert-Tailored Solutions
See step-by-step solutions with expert insights and AI powered tools for academic success
Step: 2
Step: 3
Ace Your Homework with AI
Get the answers you need in no time with our AI-driven, step-by-step assistance