Answered step by step
Verified Expert Solution
Link Copied!

Question

1 Approved Answer

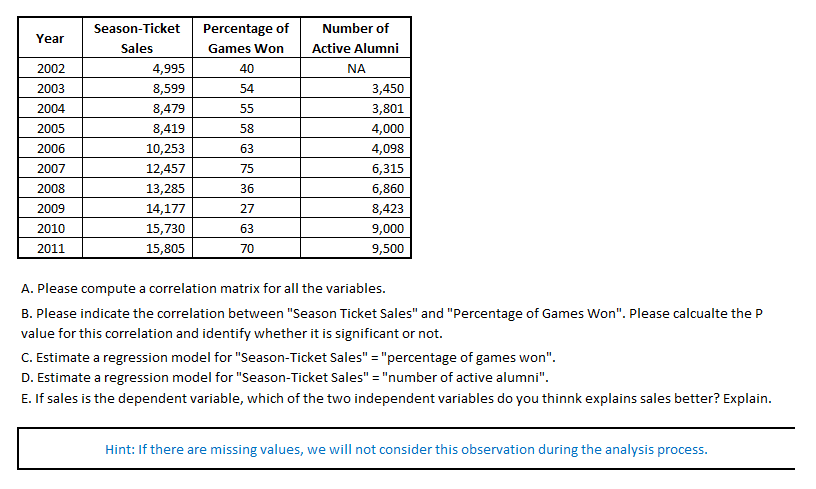
Please help answer the following Year Season-Ticket Percentage of Number of Sales Games Won Active Alumni 2002 4,995 40 NA 2003 8,599 54 3,450 2004

Please help answer the following

image text in transcribed
Year Season-Ticket Percentage of Number of Sales Games Won Active Alumni 2002 4,995 40 NA 2003 8,599 54 3,450 2004 8,479 55 3,801 2005 3,419 58 4,000 2006 10,253 63 4,098 2007 12,457 75 6,315 2008 13,285 36 6,860 2009 14,177 27 8,423 2010 15,730 63 9,000 2011 15,805 70 9,500 A. Please compute a correlation matrix for all the variables. B. Please indicate the correlation between "Season Ticket Sales" and "Percentage of Games Won". Please calcualte the P value for this correlation and identify whether it is significant or not. C. Estimate a regression model for "Season-Ticket Sales" = "percentage of games won". D. Estimate a regression model for "Season-Ticket Sales" = "number of active alumni". E. If sales is the dependent variable, which of the two independent variables do you thinnk explains sales better? Explain. Hint: If there are missing values, we will not consider this observation during the analysis process

Step by Step Solution

There are 3 Steps involved in it

Step: 1

blur-text-image

Get Instant Access to Expert-Tailored Solutions

See step-by-step solutions with expert insights and AI powered tools for academic success

Step: 2

blur-text-image

Step: 3

blur-text-image

Ace Your Homework with AI

Get the answers you need in no time with our AI-driven, step-by-step assistance

Get Started

Recommended Textbook for

Mathematical Interest Theory

Authors: Leslie Jane, James Daniel, Federer Vaaler

3rd Edition

147046568X, 978-1470465681

More Books

Students also viewed these Mathematics questions