Answered step by step
Verified Expert Solution
Link Copied!

Question

1 Approved Answer

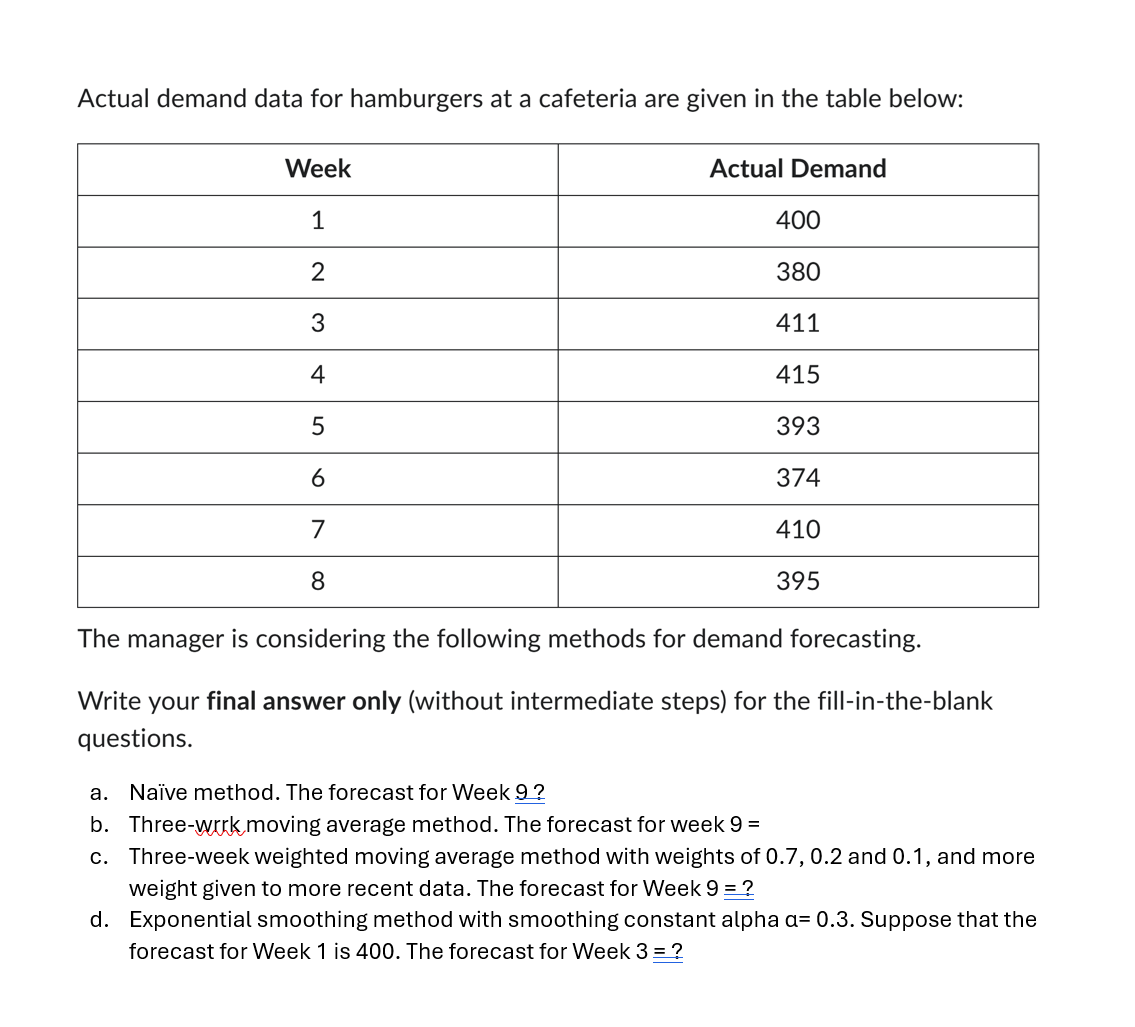
Please help answer this Actual demand data for hamburgers at a cafeteria are given in the table below: Week Actual Demand 1 400 380 411

Please help answer this

image text in transcribed
Actual demand data for hamburgers at a cafeteria are given in the table below: Week Actual Demand 1 400 380 411 415 393 374 410 OINc | MWW N 395 The manager is considering the following methods for demand forecasting. Write your final answer only (without intermediate steps) for the fill-in-the-blank questions. a. Naive method. The forecast for Week 9.2 Three-wrrk moving average method. The forecast for week 9 = Three-week weighted moving average method with weights of 0.7, 0.2 and 0.1, and more weight given to more recent data. The forecast for Week 9 =2 Exponential smoothing method with smoothing constant alpha a= 0.3. Suppose that the forecast for Week 1 is 400. The forecast for Week 3 =2

Step by Step Solution

There are 3 Steps involved in it

Step: 1

blur-text-image

Get Instant Access to Expert-Tailored Solutions

See step-by-step solutions with expert insights and AI powered tools for academic success

Step: 2

blur-text-image

Step: 3

blur-text-image

Ace Your Homework with AI

Get the answers you need in no time with our AI-driven, step-by-step assistance

Get Started

Recommended Textbook for

A First Course in Differential Equations with Modeling Applications

Authors: Dennis G. Zill

10th edition

978-1111827052

More Books

Students also viewed these Mathematics questions