

Question
PLEASE HELP! Beyond confused and professor won't provide any assistance! Just a normal assignment but is required to be completed correctly! Requirements: Choose a non-financial
PLEASE HELP! Beyond confused and professor won't provide any assistance!
Just a normal assignment but is required to be completed correctly!
Requirements:
-
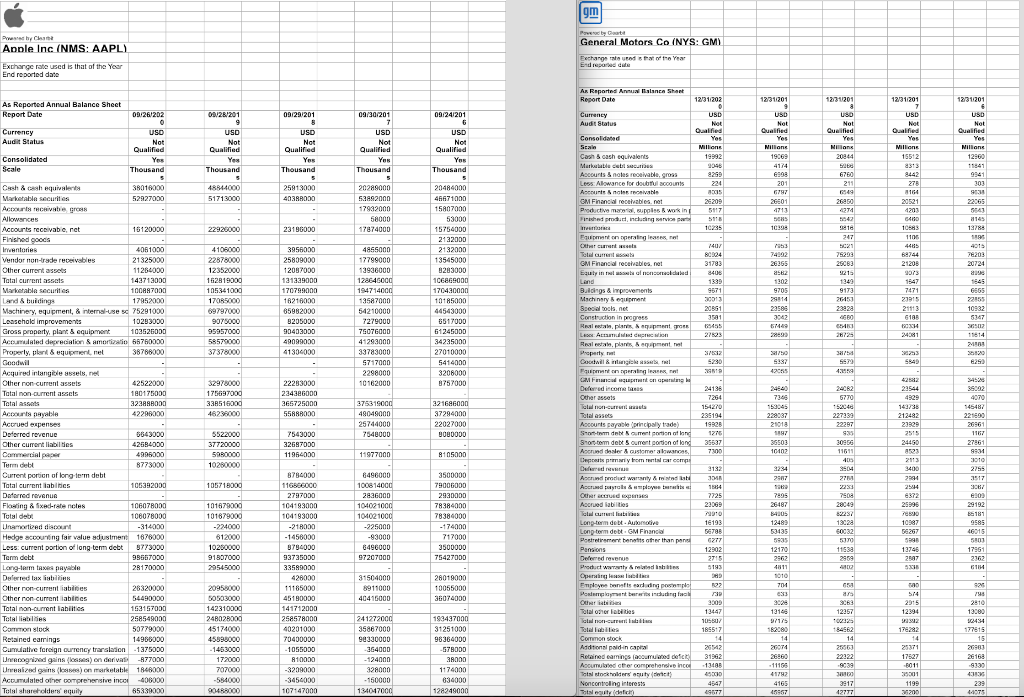
Choose a non-financial publicly traded company from the Mergent Online database. Examples of financial firms are banks and financial consulting firms. A banks financial statements are different from a firms financial statements in a non-financial sector. Therefore, dont choose any firms in the banking sectors. A publicly traded company means that it has common equity traded in a stock exchange. Download its balance sheet and income statement for the past 5 years to a spreadsheet from Mergent Online. Put these two financial statements in two separate worksheets in an Excel file.
-
Create another worksheet in the Excel file for financial ratios.
-
Each student calculates 4 different financial ratios (either in the sections of Profitability, Financial
Health, or Efficiency Ratios) for the past five years (either 2016-2020 or 2017-2021) in the Excel spreadsheet. You can use my template posted on Blackboard with headers of the financial ratios created. The followings are the ratios in each section:
Profitability: Gross margin, operating margin, EBT (Earnings Before Taxes) margin, return on assets, and return on equity. Financial Health: Current ratio, financial leverage [defined as =total assets/total stockholders equity, it is the equity multiplier you learn from the text], and debt/equity (defined as long-term debt / total stockholders equity)1.
1 Morningstar computes debt-to-equity ratio in this way, which may be different from what you see in other textbooks.
1
Efficiency Ratios: Days sales outstanding, inventory turnover (defined as Cost of Good Sold /
Average Inventory), fixed asset turnover, and asset turnover (total assets turnover).
-
When you work on the calculations, the formula you use in the Excel spreadsheet should reference the data from the Income Statement or Balance Sheet. Excel has to know the location and the name of the file, the name of the worksheet, and the cell address. Please see my example posted on Blackboard (Gap Inc Financial Statements and Ratios.xls). Please round the number to two decimal places. The profitability ratios should be expressed in percentage. You will be
asked to re-work on the project if you do not use reference cells to calculate financial ratios.
-
If you are not sure whether your ratios are computed correctly, you can compare the ratios in Morningstar database. Well, they should be close or exactly the same. The small difference may be due to the fact that Morningstar calculates the ratio using the average value of an accounting item over the past 2 years. On Morningstar, click on Key Ratios tab and Full Key Ratios Data. You will see the Profitability, Financial Health, and Efficiency Ratios. Click on these tabs, and compare the ratios you compute for the past 5 years with those posted on Morningstar. This is just for reference.
-
Please use the Z-score model to predict whether this company will experience financial distress within the next year. The Z-score model was developed by Edward I. Altman (1968).2 Regular financial ratios have deficiencies or limitations to evaluate a firms operating performance. Altman (1968) uses a few modified ratios and a technique called multiple discriminant analysis to predict whether a firm is likely to experience severe financial distress. His Z-score model for publicly traded companies is defined as:
= 1.21 + 1.42 + 3.33 + 0.64 + 5 where 1 =
Net working capital = Current assets Current liabilities
2 = 3 = EBIT is earnings before interest and taxes 4 = 5 =
2 For details, please see E. I. Altman, Financial Ratios, Discriminant Analysis and the Prediction of Corporate Bankruptcy, Journal of Finance, September 1968, pp. 589-609.
2
The most recent years market capitalization can be found via the Company Financials tab on Mergent Online. It is on the upper right portion of the webpage called Market Cap. Please convert the market capitalization to thousands because most of the accounting items reported in the income statement and balance sheet are in thousands. Altman (1968) shows that Z-scores are broadly classified into three ranges associated with three scenarios.
2.675
Bankruptcy predicted within one year Financial distress, possible bankruptcy No financial distress predicted
Please compute the Z-score for the company you choose in an Excel worksheet, and discuss whether this company will experience financial distress in the upcoming year. Again, your calculations of 1,..., 5, and Z-score should reference to the data in the Income Statement and Balance Sheet in the Excel file.
Step by Step Solution
There are 3 Steps involved in it
Step: 1

Get Instant Access to Expert-Tailored Solutions
See step-by-step solutions with expert insights and AI powered tools for academic success
Step: 2

Step: 3
Ace Your Homework with AI
Get the answers you need in no time with our AI-driven, step-by-step assistance
Get Started
Tidy Finance With R
Authors: Christoph Scheuch, Stefan Voigt, Patrick Weiss
1st Edition
1032389346, 978-1032389349