Question: please help code this in c++ the assignment starts below the dashed line ----------------------------------------------------------------------------------------------------------- Topography (Part 1) In this homework, you will read a set
please help code this in c++ the assignment starts below the dashed line
-----------------------------------------------------------------------------------------------------------
Topography (Part 1)
In this homework, you will read a set of topographic (land elevation) data into a 2D vector and manipulate the data so that it can be visualized.
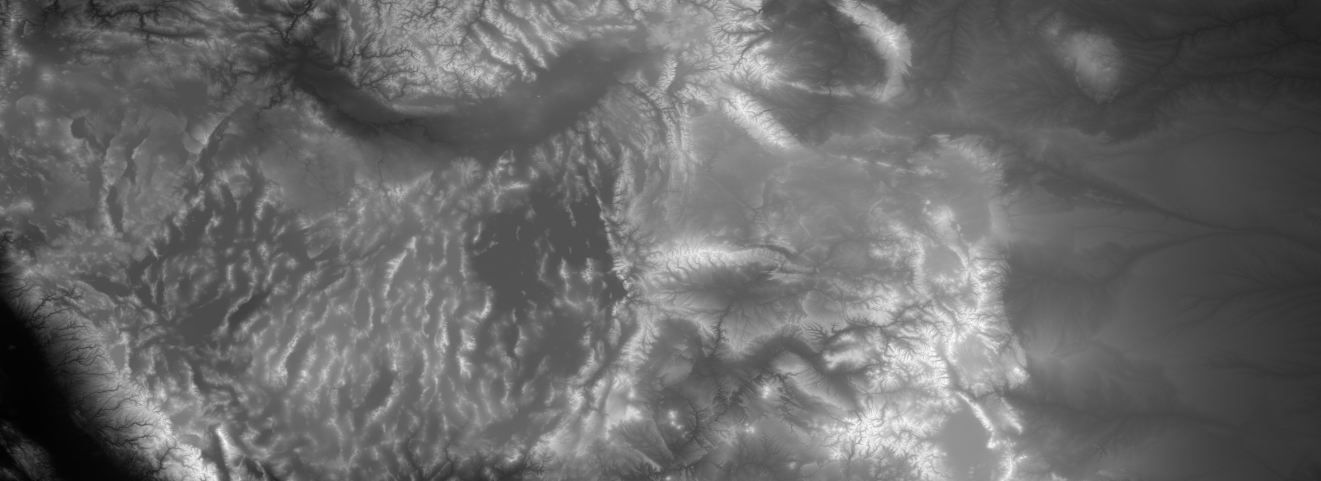
You will write code to read elevation data and produce a file representing an image that, when visualized, displays each position on the map with a color that represents the position elevation. The visualization will produce a picture like the one below:

Program Flow
- Read the data into a 2D array
- Find min and max elevation to correspond to darkest and brightest color, respectively
- Compute the shade of gray for each cell in the map
- Produce the output file in the specified format (BMP)
Step 1 - Read the data into a 2D array
Your first goal is to read the values into a 2D array (i.e., a matrix) of ints from the data file. Note: You should use a vector to benefit from the additional runtime checks.
This data file contains, in plain text, data representing the average elevations of patches of land (roughly 700x700 meters) in the US, stretching from California to Colorado.
Optionally, other input files can be obtained from the National Oceanic and Atmospheric Administration (Links to an external site.)Links to an external site. if you are interested in making your own outside of this project. Select an area and download the data in "ArcGIS ASCII Grid" format.
You can change the extension of the file to .txt to read it as text, or you can open it in Notepad++. You will see that the file contains a header that contains information about the file: number of columns (width), number of rows (height), the GPS coordinates of the lower left corner of the map, and the size of the cell in degrees. You will want to extract the width and the height from this header. You can ignore the rest of it.
After the header comes a large, space-separated list of integers. There are height x width integers representing a height-row by width-col grid. Each integer is the average elevation in meters of each cell in the grid. The data is listed in row-major order, i.e., the first width numbers for row 0, then width numbers for row 1, etc.
Step 2 - Find the min and max values
In order to draw the map with a gray scale that indicates the elevation, you will need to determine which scale to use, i.e., which will be shown as a dark area (with low elevation) and which ones will be shown as bright areas (high elevation.) This means you need to find the min and max values in the map first, so that you know which values to associate with the brightest and darkest colors.
You should write two functions for this that scan the entire map and keep track of the smallest and largest values found so far.
Test this functionality to make sure youre getting the correct values for min and max, before you proceed to implement the rest of the program. You may want to check with a friend or colleagues to see if other students are getting the same min and max values for the provided input file.
Step 3 - Compute the color for each part of the map
The input data file contains the elevation value for each cell in the map. Now you need to compute the color (in a gray scale between white and black) to use to represent these evaluation values. The shade of gray should be scaled to the elevation of the map.
Traditionally, images are represented and displayed in electronic systems (such as TVs and computers) through the RGB color model, an additive color model in which red, green, and blue light are added together in various ways to reproduce a broad array of colors. In this model, colors are represented through three integers (R, G, and B) values between 0 and 255. For example, (0, 0, 255) represents blue and (255, 255, 0) represents yellow. In RGB color, if each of the three RGB values are the same, we get a shade of gray. Thus, there are 256 possible shades of gray from black (0,0,0) to middle gray (128,128,128), to white (255,255,255).
To make the shade of gray, you should use the min and max values in the 2D array to scale each integer (elevation data) to a value between 0 and 255 inclusive. For example, if your minimum elevation was 1000 and your maximum was 2000, an elevation of 1500 would map to a grayscale value of 127.
int mapRange(int n, int fromLow, int fromHigh, int toLow, int toHigh)
You can come up with a formula for this by finding the distance between fromLow and fromHigh, then finding out what percent n is of that distance, then multiplying that percentage by the distance between toLow and toHigh.
Step 4 - Create the Image
Create a 2D array of rgb pixel values, where r, g, and b are a grayscale value. Create a Bmp object from the provided source files, assign each grayscale pixel value to correspond to each elevation value, and then write the Bmp object to a file as shown in lecture. You should then see a beautiful image of the Sierra Nevada Mountains!
Object-Oriented Design
Use a class called Topograph to organize the data. The header file is attached below and also written here:
class Topograph { public: ///Constructor. Open a ArcGIS ASCII Grid file ///read the header to assign height and width ///resize v and read elevation data Topograph(string fileName); int getHeight(){return height;} int getWidth(){return width;} ///find min and max elevation values ///call mapRange to convert each elevation to grayscale ///set each bmp(i,j) to its grayscale value void drawMap(Bmp& bmp); private: void findMin(); void findMax(); ///scale n from [fromLow:fromHigh] to [toLow:toHigh] int mapRange(int n, int fromLow, int fromHigh, int toLow, int toHigh); vector> v; int height; int width; int min; int max; }; - From main, construct a Topograph object with the file name "map_input.txt".
- Construct a Bmp object with the same height and width as your Topograph object.
- Call drawMap on your Topograph object and pass in the Bmp object as an argument
- Call write on your Bmp object with the file name "map.bmp"
- To easily view the image in Windows, type the following to open "map.bmp" with the default image viewer:
system(outputFileName.c_str());
Elevation Data File
map_input.txt
Provided Source Files
- Bmp.h and Bmp.cpp from lecture.
- They are posted in the M05 Source Files page.
- You do not have to change them.
- Topograph.h

Source Files to Implement
- Topograph.cpp
- main.cpp
Scoring
- Associate all of your source files with a Codeblocks project (.cbp), zip the project folder, including the data files, and upload your .zip file here.
- If you do not have Codeblocks on your machine you will have to do this in the lab
- Don't worry about Linux for this assignment. We won't be able to view the image from the terminal.
- (2 pts) Output the height (rows) and width (columns) of the elevation data file and load the elevations into v
- (2 pts) Output the correct min and max values
- (6 pts) Write and display map.bmp so it matches the file posted above.
- Code that does not build will not receive credit.
Greedy Walk (Part 2)

There are many contexts in which you want to know the most efficient way to travel over land. When traveling through mountains (let's say you're walking) perhaps you want to take the route that requires the least total change in elevation with each step you take call it the path of least resistance. Given some topographic data it should be possible to calculate a "greedy lowest-elevation-change walk" from one side of a map to the other.
A "greedy" algorithm is one in which, in the face of too many possible choices, you make a choice that seems best at that moment.

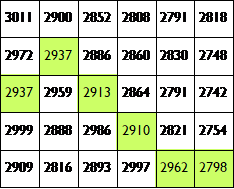
Since our map is in a 2D grid, we can envision a "walk" as starting in some in some cell at the left-most edge of the map (column 0) and proceeding forward by taking a "step" into one of the 3 adjacent cells in the next column over (column 1). Our "greedy walk" will assume that you will choose the cell whose elevation is closest to the elevation of the cell you're standing in. (NOTE: this might mean walking uphill or downhill).
The diagrams below show a few scenarios for choosing where to take the next step. In the case of a tie with the forward position, you should always choose to go straight forward. In the case of a tie between the two non-forward locations, you should always choose to go down.

-
Case 1: smallest change is 5, go fwd-down
-
Case 2: smallest change is 3, go fwd
-
Case 3: smallest change is a tie (3), fwd is an option, so go fwd
-
Case 4: smallest change is a tie (4), choose fwd-down
Object-Oriented Design
Notice that the header file provided above in part 1 has some function prototypes for part 2:
///Draw one greedy path ///call moveForward to advance (i,j) ///set each bmp(i,j) to color ///returns the total sum of the elevation change int drawGreedyPath(Bmp& bmp, int startingRow, rgb color); ///call drawGreedyPath for each startingRow, color red ///store the index of the path with lowest elevation change ///call drawGreedyPath for the lowest index, color blue void drawBestPath(Bmp& bmp); ///Advance (i,j) along its greedy path ///Choose the right side adjacent index with the lowest elevation change ///For a tie, mid has highest priority, then down, then up ///i + 1 is down, i - 1 is up ///j + 1 is forward ///Be careful if i is on the upper or lower edge void moveForward(int& i, int& j);
Step 1 Draw a lowest-elevation-change path from some row
Implement the drawGreedyPath method. Note that this method does two things: 1) it draws the path, 2) it calculates and returns the total elevation change on that path.
The method should draw a line by drawing pixels in a different color on top of the existing drawing. The path should be drawn going West-to-East, starting from the given row using the greedy lowest-elevation-change technique described earlier.
You will need to do the following things in some order.
- Starting from the given row, and column 0, color it red (or whatever color you want to draw your path).
- Write a loop that generates every possible column across the map (you start at column 0, but column 1 is the first column you need to make choice about where to step). For each column you will decide which row to take your next step to fwd, fwd-and-up, or fwd-and-down - using the greedy choice strategy described.
- Color the chosen location to step to red (or whatever color you choose).
- Use a variable that keeps track of the current row youre on, and update it each time you take a step forward the row may stay the same, or go up or down by 1 depending how you walk.
- Use fabs to get the absolute value of the difference between two elevations.
- Continue finding the lowest neighboring cell and coloring it red as you go.
- Keep a running total of the total elevation change that would be 'experienced' by a person walking this path. Since we consider an elevation change the absolute value (i.e. going 'uphill' 10 meters is the same amount of change as going 'downhill' 10 meters) this running total will be non-decreasing and will end up being a pretty large positive number
Use the moveForward to choose and advance the row and column to the next cell.
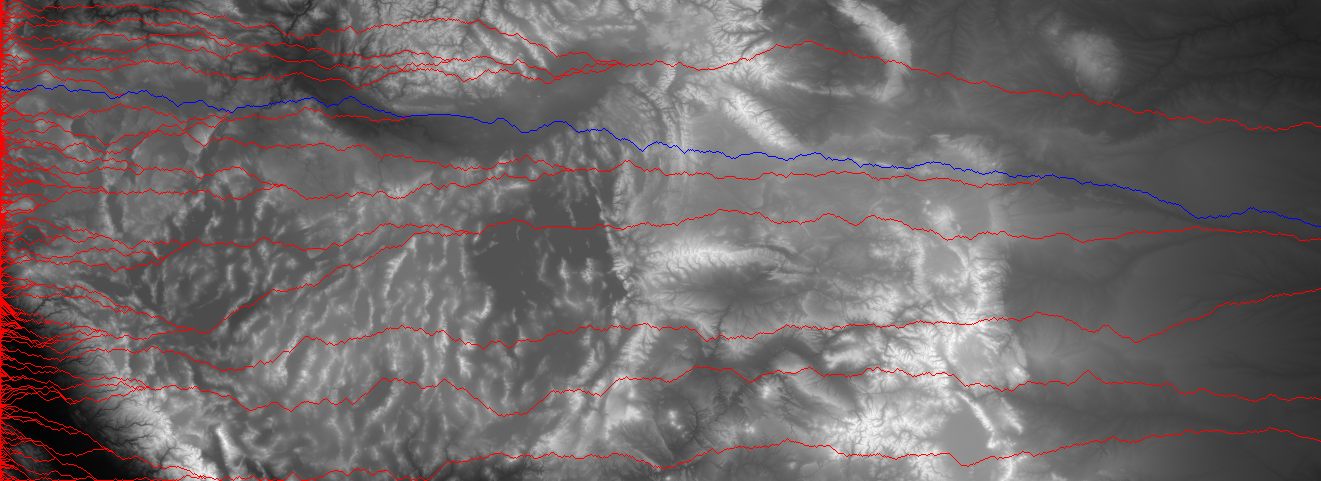
When youre done you should see a line tracing the lowest elevation-change path from west to east.
Step 2 find the lowest elevation path for the whole map
Implement the drawBestPath method which calls drawGreedyPath for each row, then finds the overall lowest-elevation-change path and draw it.
You will find the lowest-elevation-change route by noting that drawGreedyPath returns the total elevation change for a path starting at a given row. If you write a loop that generates every possible starting row and call drawGreedyPath for each, you should find the lowest route for the whole map. Since that method also draws all of the routes it's good feedback that the method is running properly. You should end up with something that looks like the image above.
From main, call drawBestPath from your Topograph object and pass in the Bmp object as an argument. Write to "map2.bmp" with your Bmp object, and use the system call to display it.
30I1 2900 2852 280B 279 2818 2972 29372886 286028302748 2937 2959 2913 286A 2791 2742 299928BB2986 2910 2821l 2754 29092BI6 28932997 2962 2798 das dange dang dhng dang 09 9 100 1077 105 5 109 9 100 97 3 105 5 97 3 100 97 3 105 5 964 00 1055 104 4 30I1 2900 2852 280B 279 2818 2972 29372886 286028302748 2937 2959 2913 286A 2791 2742 299928BB2986 2910 2821l 2754 29092BI6 28932997 2962 2798 das dange dang dhng dang 09 9 100 1077 105 5 109 9 100 97 3 105 5 97 3 100 97 3 105 5 964 00 1055 104 4
Step by Step Solution
There are 3 Steps involved in it

Get step-by-step solutions from verified subject matter experts


