Question
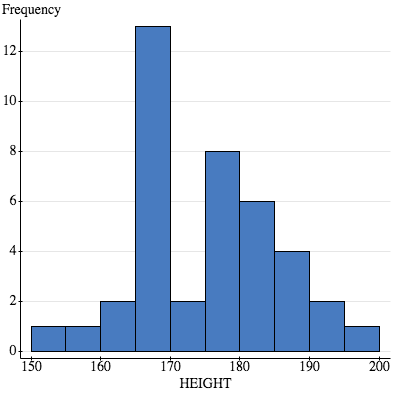
Please help! discuss what your histogram tells you about your data . Please include concepts such as the shape of the graph, the highest and
Please help!
discuss what your histogram tells you about your data . Please include concepts such as the shape of the graph, the highest and lowest frequencies, the range of the data etc. Please also briefly outline the dataset for the (i.e., this histogram shows the shoe size of men from a sample ...)
The database is below and the histogram as well (for histogram i selected the height - histogram shows the height only).
First row = sex
second = age
third = foot length
forth = shoe print
fifth = shoe size
sixth = height
M 67 27.8 31.3 11 180.3
M 47 25.7 29.7 9 175.3
M 41 26.7 31.3 11 184.8
M 42 25.9 31.8 10 177.8
M 48 26.4 31.4 10 182.3
M 34 29.2 31.9 13 185.4
M 26 26.8 31.8 11 180.3
M 29 28.1 31 10.5 175.3
M 60 25.4 29.7 9.5 177.8
M 48 27.9 31.4 11 185.4
M 30 27.5 31.4 11 190.5
M 43 28.8 31.6 12 195
M 54 26.7 31.8 10 175.3
M 31 26.7 32.4 10.5 180.3
M 42 25.1 27.6 9 172.7
M 21 28.7 31.8 12.5 182.9
M 59 29.2 31.3 11 189.2
M 58 27.9 31.3 11. 5 18 5.4
M 42 28.6 34.5 14 193.7
F 47 23.2 24.8 7 165.1
F 19 24.3 28.6 9 166.4
F 20 26 25.4 10 177.8
F 27 23.8 26.7 8 167.6
F 19 25.1 26.7 9 168.3
F 21 25.4 27.9 8.5 165.7
F 32 21.9 27.9 8 165.1
F 19 26.2 28.9 11 165.1
F 27 23.8 27.9 8 165.1
F 18 22.2 25.9 9.5 152.4
F 26 24.6 25.4 8.5 162.6
F 36 24.6 28.1 9 179.1
F 28 23.7 27.6 9 175.9
F 29 25.6 26.5 8.5 166.4
F 58 24.1 26.5 7 167.6
F 30 23.8 28.4 9 162.6
F 23 23.3 26.5 8 167.6
F 26 23.5 26 8 165.1
F 47 25.1 27 10 172.7
F 36 24.1 25.1 7.5 157.5
F 19 23.8 27.9 10 167.6

Step by Step Solution
There are 3 Steps involved in it
Step: 1

Get Instant Access to Expert-Tailored Solutions
See step-by-step solutions with expert insights and AI powered tools for academic success
Step: 2

Step: 3

Ace Your Homework with AI
Get the answers you need in no time with our AI-driven, step-by-step assistance
Get Started


