Answered step by step
Verified Expert Solution
Link Copied!

Question

1 Approved Answer

Please help I have been struggling with these two. An experiment with k = 3 categories and n = 100 produced the data shown in

Please help I have been struggling with these two.
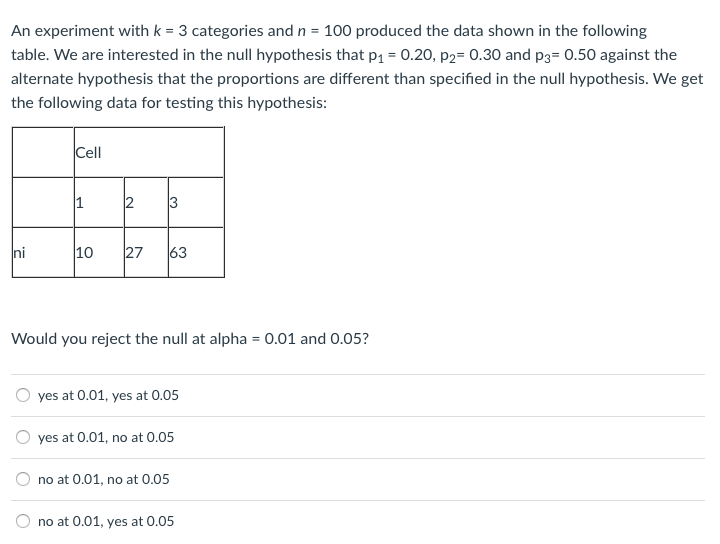
image text in transcribedimage text in transcribed
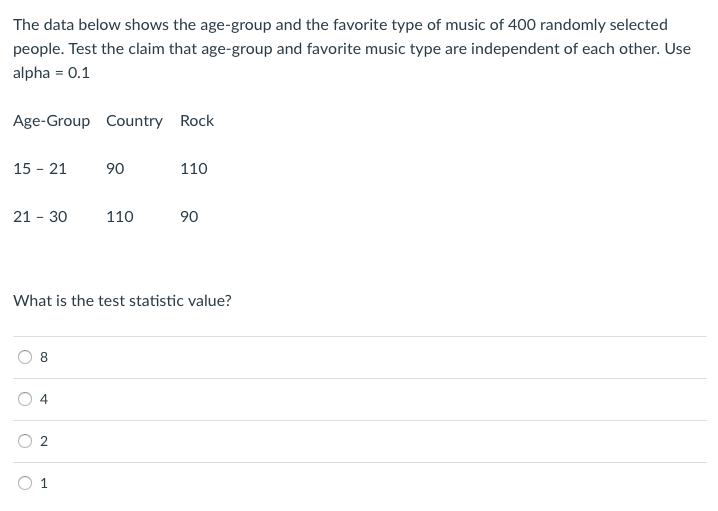
An experiment with k = 3 categories and n = 100 produced the data shown in the following table. We are interested in the null hypothesis that p1 = 0.20, p2= 0.30 and p3= 0.50 against the alternate hypothesis that the proportions are different than specied in the null hypothesis. We get the following data for testing this hypothesis: Would you reject the null at alpha = 0.01 and 0.05? (3. yes at 0.01r yes at 0.05 (3. yes at 0.01r no at 0.05 C. no at 0.01, no at 0.05 C. no at 0.01, yes at 0.05 The data below shows the age - group and the favorite type of music of 400 randomly selected people . Test the claim that age- group and favorite music type are independent of each other Use alpha = 0. 1 Age Group Country Rock 15 - 21 90 110 21 - 30 110 90 What is the test statistic value ? 04 O

Step by Step Solution

There are 3 Steps involved in it

Step: 1

blur-text-image

Get Instant Access to Expert-Tailored Solutions

See step-by-step solutions with expert insights and AI powered tools for academic success

Step: 2

blur-text-image_2

Step: 3

blur-text-image_3

Ace Your Homework with AI

Get the answers you need in no time with our AI-driven, step-by-step assistance

Get Started

Recommended Textbook for

Mathematics For Retail Buying

Authors: Marla Greene, Bette K. Tepper

9th Edition

1501356704, 9781501356704

More Books

Students also viewed these Mathematics questions

Question

How can the scrum process overcome the problems of the SDLC?

Answered: 1 week ago