Please help. I uploaded the picture of what the exercise is asking as well as the data we obtained after doing the experiment. This is all the information I have. Thank you!
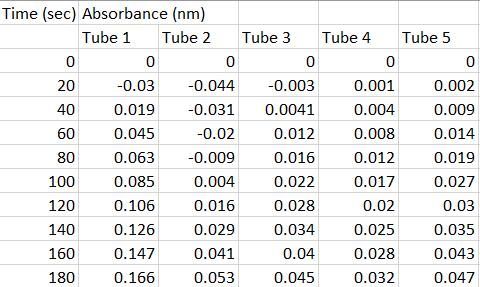
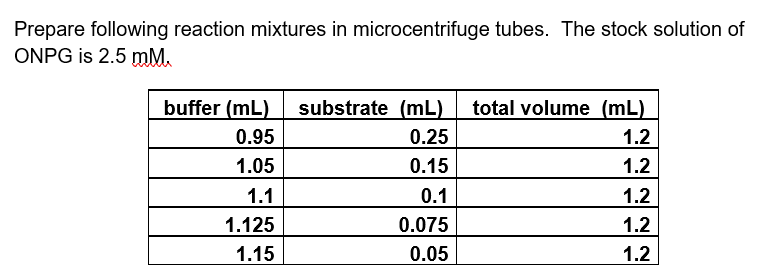
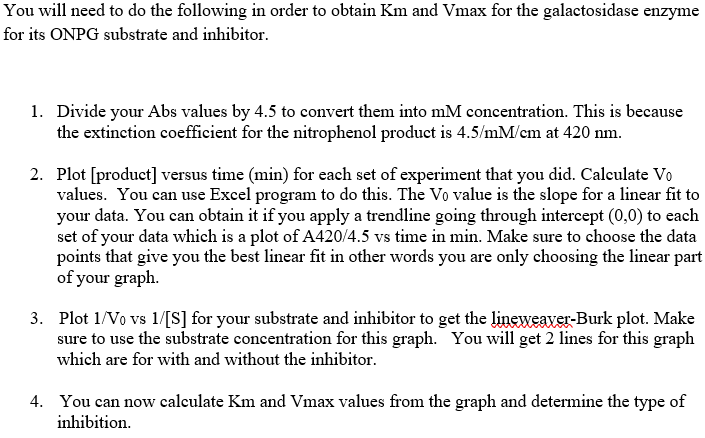
Time (sec) Absorbance (nm) Tube 1 Tube 2 Tube 3 Tube 4 Tube 5 0 0 0 0 0 0 20 -0.03 -0.044 -0.003 0.001 0.002 40 0.019 -0.031 0.0041 0.004 0.009 60 0.045 -0.02 0.012 0.008 0.014 80 0.063 -0.009 0.016 0.012 0.019 100 0.085 0.004 0.022 0.017 0.027 120 0.106 0.016 0.028 0.02 0.03 140 0.126 0.029 0.034 0.025 0.035 160 0.147 0.041 0.04 0.028 0.043 180 0.166 0.053 0.045 0.032 0.047 Prepare following reaction mixtures in microcentrifuge tubes. The stock solution of ONPG is 2.5 mm buffer (mL) substrate (mL) total volume (mL) 0.95 0.25 1.2 1.05 0.15 1.2 1.1 0.1 1.2 1.125 0.075 1.2 1.15 0.05 1.2 NNNN You will need to do the following in order to obtain Km and Vmax for the galactosidase enzyme for its ONPG substrate and inhibitor. 1. Divide your Abs values by 4.5 to convert them into mM concentration. This is because the extinction coefficient for the nitrophenol product is 4.5/mM/cm at 420 nm. 2. Plot [product] versus time (min) for each set of experiment that you did. Calculate Vo values. You can use Excel program to do this. The Vo value is the slope for a linear fit to your data. You can obtain it if you apply a trendline going through intercept (0,0) to each set of your data which is a plot of A420/4.5 vs time in min. Make sure to choose the data points that give you the best linear fit in other words you are only choosing the linear part of your graph. 3. Plot 1/Vo vs 1/[S] for your substrate and inhibitor to get the lineweaver-Burk plot. Make sure to use the substrate concentration for this graph. You will get 2 lines for this graph which are for with and without the inhibitor. 4. You can now calculate Km and Vmax values from the graph and determine the type of inhibition. Time (sec) Absorbance (nm) Tube 1 Tube 2 Tube 3 Tube 4 Tube 5 0 0 0 0 0 0 20 -0.03 -0.044 -0.003 0.001 0.002 40 0.019 -0.031 0.0041 0.004 0.009 60 0.045 -0.02 0.012 0.008 0.014 80 0.063 -0.009 0.016 0.012 0.019 100 0.085 0.004 0.022 0.017 0.027 120 0.106 0.016 0.028 0.02 0.03 140 0.126 0.029 0.034 0.025 0.035 160 0.147 0.041 0.04 0.028 0.043 180 0.166 0.053 0.045 0.032 0.047 Prepare following reaction mixtures in microcentrifuge tubes. The stock solution of ONPG is 2.5 mm buffer (mL) substrate (mL) total volume (mL) 0.95 0.25 1.2 1.05 0.15 1.2 1.1 0.1 1.2 1.125 0.075 1.2 1.15 0.05 1.2 NNNN You will need to do the following in order to obtain Km and Vmax for the galactosidase enzyme for its ONPG substrate and inhibitor. 1. Divide your Abs values by 4.5 to convert them into mM concentration. This is because the extinction coefficient for the nitrophenol product is 4.5/mM/cm at 420 nm. 2. Plot [product] versus time (min) for each set of experiment that you did. Calculate Vo values. You can use Excel program to do this. The Vo value is the slope for a linear fit to your data. You can obtain it if you apply a trendline going through intercept (0,0) to each set of your data which is a plot of A420/4.5 vs time in min. Make sure to choose the data points that give you the best linear fit in other words you are only choosing the linear part of your graph. 3. Plot 1/Vo vs 1/[S] for your substrate and inhibitor to get the lineweaver-Burk plot. Make sure to use the substrate concentration for this graph. You will get 2 lines for this graph which are for with and without the inhibitor. 4. You can now calculate Km and Vmax values from the graph and determine the type of inhibition