Please help- I'm in a self-taught class and have no idea how to grasp these questions. 1a. When comparing the assets on the balance sheet, what account should the analyst question? 1b. What was the Net Working Capital for the Most Current Year and Previous Year? 1c. How big of a factor would you say market conditions were on the performance over the last 10 years? 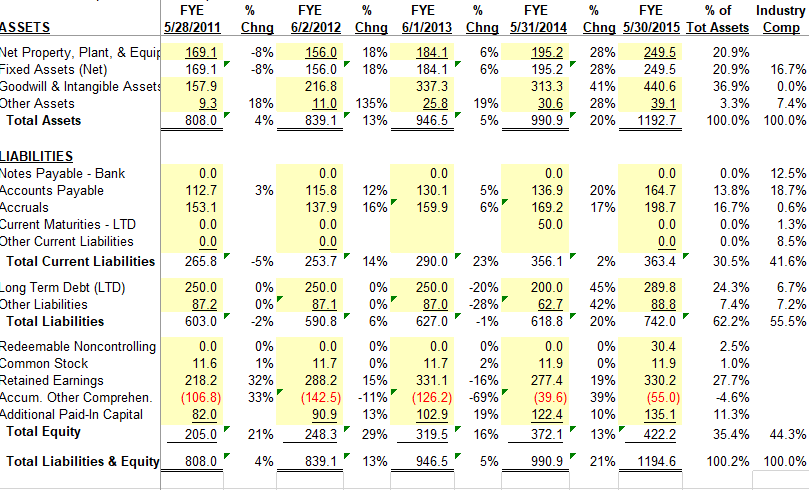
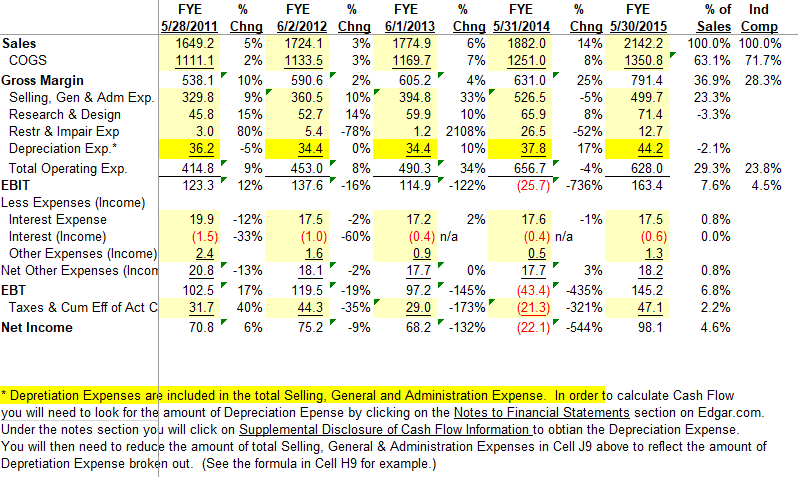
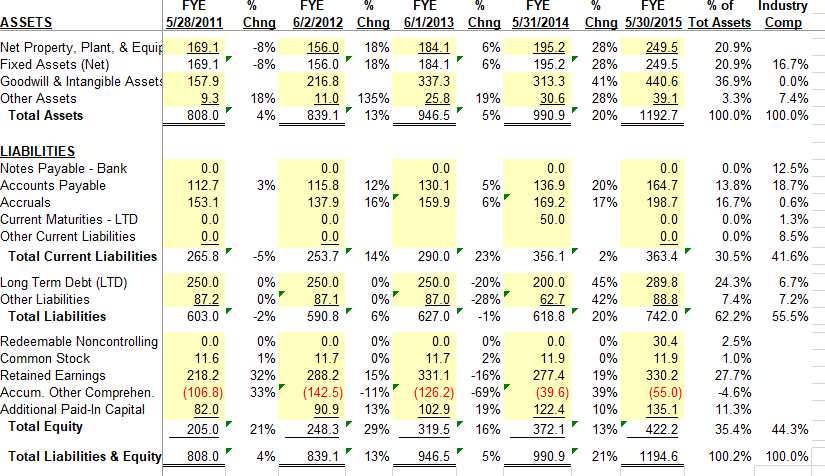
FYE ASSETS 5/28/2011 Net Property, Plant, & Equip 169.1 Fixed Assets (Net) 169.1 Goodwill & Intangible Assets 157.9 Other Assets 9.3 Total Assets 808.0 % FYE % FYE % FYE % FYE % of Industry Chng 6/2/2012 Chng 6/1/2013 Chng 5/31/2014 Chng 5/30/2015 Tot Assets Comp -8% 156.0 18% 184.1 6% 195.2 28% 249.5 20.9% -8% 156.0 18% 184.1 6% 195.2 28% 249.5 20.9% 16.7% 216.8 337.3 313.3 41% 440.6 36.9% 0.0% 18% 11.0 135% 25.8 19% 30.6 28% 39.1 3.3% 7.4% 4% 839.1 13% 946.5 5% 990.9 20% 1192.7 100.0% 100.0% 3% 12% 16% 0.0 130.1 159.9 5% 6% 0.0 112.7 153.1 0.0 0.0 265.8 20% 17% 0.0 115.8 137.9 0.0 0.0 253.7 0.0 136.9 169.2 50.0 0.0 164.7 198.7 0.0 0.0 363.4 0.0% 13.8% 16.7% 0.0% 0.0% 30.5% 12.5% 18.7% 0.6% 1.3% 8.5% 41.6% -5% 14% 23% 356.1 2% LIABILITIES Notes Payable - Bank Accounts Payable Accruals Current Maturities - LTD Other Current Liabilities Total Current Liabilities Long Term Debt (LTD) Other Liabilities Total Liabilities Redeemable Noncontrolling Common Stock Retained Earnings Accum. Other Comprehen. Additional Paid-In Capital Total Equity 0% 0% -2% 290.0 250.0 87.0 627.0 -20% -28% -1% 200.0 62.7 618.8 45% 42% 20% 24.3% 7.4% 62.2% 6.7% 7.2% 55.5% 0.0 250.0 87.2 603.0 0.0 11.6 218.2 (106.8) 82.0 205.0 0% 1% 32% 33% 250.0 0% 87.1 0% 590.8 6% 0% 11.7 0% 288.2 15% (142.5) -11% 90.9 13% 248.3 29% 0.0 0% 11.7 2% 331.1 -16% (1262) -69% 102.9 19% 319.5 16% 0.0 11.9 277.4 (39.6) 122.4 372.1 0% 0% 19% 39% 10% 289.8 88.8 742.0 30.4 11.9 330.2 (55.0) 135.1 422.2 2.5% 1.0% 27.7% 4.6% 11.3% 35.4% 21% 13% 44.3% Total Liabilities & Equity 808.0 4% 839.1 13% 946.5 5% 990.9 21% 1194.6 100.2% 100.0% 3% 7% % of Ind Sales Comp 100.0% 100.0% 63.1% 71.7% 36.9% 28.3% 23.3% -3.3% FYE % FYE % FYE % FYE % FYE 5/28/2011 Chng 6/2/2012 Chng 6/1/2013 Chng 5/31/2014 Chng 5/30/2015 Sales 1649.2 5% 1724.1 3% 1774.9 6% 1882.0 14% 2142.2 COGS 1111.1 2% 1133.5 1169.7 1251.0 8% 1350.8 Gross Margin 538.1' 10% 590.6 2% 605.2 4% 631.0 25% 791.4 Selling, Gen & Adm Exp. 329.8 9% 360.5 10% 394.8 33% 526.5 -5% 499.7 Research & Design 45.8 15% 52.7 14% 59.9 10% 65.9 8% 71.4 Restr & Impair Exp 3.0 80% 5.4 -78% 1.2 2108% 26.5 -52% 12.7 Depreciation Exp.* 36.2 -5% 34.4 0% 34.4 10% 37.8 17% 44.2 Total Operating Exp. 414.8 9% 453.0 8% 490.3 34% 656.7 4% 628.0 EBIT 123.3 12% 137.6 -16% 114.9 -122% (25.7) -736% 163.4 Less Expenses (Income) Interest Expense 19.9 -12% 17.5 -2% 17.2 2% 17.6 -1% 17.5 Interest (Income) (1.5) -33% (1.0) -60% (0.4) n/a (0.4) n/a (0.6) Other Expenses (Income) 2.4 1.6 0.9 0.5 1.3 Net Other Expenses (Incon 20.8 -13% 18.1 -2% 17.7 0% 17.7 3% 18.2 EBT 102.5 17% 119.5 -19% 97.2 - 145% (43.4) 435% 145.2 Taxes & Cum Eff of Act C 31.7 40% 44.3 -35% 29.0 -173% (21.3) -321% 47.1 Net Income 6% 75.2 -9% 68.2 -132% (22.1) -544% 98.1 -2.1% 29.3% 23.8% 7.6% 4.5% 0.8% 0.0% 0.8% 6.8% 2.2% 4.6% 70.8' * Depretiation Expenses are included in the total Selling, General and Administration Expense. In order to calculate Cash Flow you will need to look for the amount of Depreciation Epense by clicking on the Notes to Financial Statements section on Edgar.com. Under the notes section you will click on Supplemental Disclosure of Cash Flow Information to obtian the Depreciation Expense. You will then need to reduce the amount of total Selling, General & Administration Expenses in Cell J9 above to reflect the amount of Depretiation Expense broken out. (See the formula in Cell H9 for example.) FYE ASSETS 5/28/2011 Net Property, Plant, & Equip 169.1 Fixed Assets (Net) 169.1 Goodwill & Intangible Assets 157.9 Other Assets 9.3 Total Assets 808.0 FYE FYE % FYE FYE % of Industry Chng 6/2/2012 Chng 6/1/2013 Chng 5/31/2014 Chng 5/30/2015 Tot Assets Comp -8% 156.0 18% 184.1 6% 1952 28% 249.5 20.9% -8% 156.0 18% 184.1 6% 195.2 28% 249.5 20.9% 16.7% 216.8 337.3 41% 440.6 36.9% 0.0% 18% 11.0 135% 25.8 19% 30.6 28% 39.1 3.3% 7.4% 4% 839.1 13% 946.5 5% 990.9 20% 1192.7 100.0% 100.0% 313.3 F 0.0 0.0 3% 12% 16% 130.1 159.9 5% 6%" 0.0 112.7 153.1 0.0 0.0 265.8 20% 17% 0.0 115.8 137.9 0.0 0.0 253.7 0.0 136.9 169.2 50.0 164.7 198.7 0.0 0.0 363.4 0.0% 13.8% 16.7% 0.0% 0.0% 30.5% 12.5% 18.7% 0.6% 1.3% 8.5% 41.6% -5% 14% 290.0 23% 2% LIABILITIES Notes Payable - Bank Accounts Payable Accruals Current Maturities - LTD Other Current Liabilities Total Current Liabilities Long Term Debt (LTD) Other Liabilities Total Liabilities Redeemable Noncontrolling Common Stock Retained Earnings Accum. Other Comprehen. Additional Paid-In Capital Total Equity 0% 0% 289.8 88.8 742.0 24.3% 7.4% 62.2% 6.7% 7.2% 55.5% -2% 250.0 87.2 603.0 0.0 11.6 218.2 (1068) 82.0 205.0 0% 1% 32% 33% 250.0 0% 87.1 0%" 590.8 6% 0.0 0% 11.7 0% 288.2 15% (142.5) - 11% 90.9 13% 248.3 29% 250.0 -20% 870 -28% 627.0 -1% 0.0 0% 11.7 2% 331.1 -16% (126.2) -69% 102.9 19% 319.5 16% 356.1 200.0 62.7 618.8 0.0 11.9 277.4 (39.6) 122.4 372.1 45% 42% 20% 0% 0% 19% 39% 10% 13% 30.4 11.9 330.2 (55.0) 135.1 4222 2.5% 1.0% 27.7% 4.6% 11.3% 35.4% 21% 44.3% Total Liabilities & Equity 808.0 4% 839.1 13% 946.5 5% 990.9 21% 1194.6 100.2% 100.0% FYE ASSETS 5/28/2011 Net Property, Plant, & Equip 169.1 Fixed Assets (Net) 169.1 Goodwill & Intangible Assets 157.9 Other Assets 9.3 Total Assets 808.0 % FYE % FYE % FYE % FYE % of Industry Chng 6/2/2012 Chng 6/1/2013 Chng 5/31/2014 Chng 5/30/2015 Tot Assets Comp -8% 156.0 18% 184.1 6% 195.2 28% 249.5 20.9% -8% 156.0 18% 184.1 6% 195.2 28% 249.5 20.9% 16.7% 216.8 337.3 313.3 41% 440.6 36.9% 0.0% 18% 11.0 135% 25.8 19% 30.6 28% 39.1 3.3% 7.4% 4% 839.1 13% 946.5 5% 990.9 20% 1192.7 100.0% 100.0% 3% 12% 16% 0.0 130.1 159.9 5% 6% 0.0 112.7 153.1 0.0 0.0 265.8 20% 17% 0.0 115.8 137.9 0.0 0.0 253.7 0.0 136.9 169.2 50.0 0.0 164.7 198.7 0.0 0.0 363.4 0.0% 13.8% 16.7% 0.0% 0.0% 30.5% 12.5% 18.7% 0.6% 1.3% 8.5% 41.6% -5% 14% 23% 356.1 2% LIABILITIES Notes Payable - Bank Accounts Payable Accruals Current Maturities - LTD Other Current Liabilities Total Current Liabilities Long Term Debt (LTD) Other Liabilities Total Liabilities Redeemable Noncontrolling Common Stock Retained Earnings Accum. Other Comprehen. Additional Paid-In Capital Total Equity 0% 0% -2% 290.0 250.0 87.0 627.0 -20% -28% -1% 200.0 62.7 618.8 45% 42% 20% 24.3% 7.4% 62.2% 6.7% 7.2% 55.5% 0.0 250.0 87.2 603.0 0.0 11.6 218.2 (106.8) 82.0 205.0 0% 1% 32% 33% 250.0 0% 87.1 0% 590.8 6% 0% 11.7 0% 288.2 15% (142.5) -11% 90.9 13% 248.3 29% 0.0 0% 11.7 2% 331.1 -16% (1262) -69% 102.9 19% 319.5 16% 0.0 11.9 277.4 (39.6) 122.4 372.1 0% 0% 19% 39% 10% 289.8 88.8 742.0 30.4 11.9 330.2 (55.0) 135.1 422.2 2.5% 1.0% 27.7% 4.6% 11.3% 35.4% 21% 13% 44.3% Total Liabilities & Equity 808.0 4% 839.1 13% 946.5 5% 990.9 21% 1194.6 100.2% 100.0% 3% 7% % of Ind Sales Comp 100.0% 100.0% 63.1% 71.7% 36.9% 28.3% 23.3% -3.3% FYE % FYE % FYE % FYE % FYE 5/28/2011 Chng 6/2/2012 Chng 6/1/2013 Chng 5/31/2014 Chng 5/30/2015 Sales 1649.2 5% 1724.1 3% 1774.9 6% 1882.0 14% 2142.2 COGS 1111.1 2% 1133.5 1169.7 1251.0 8% 1350.8 Gross Margin 538.1' 10% 590.6 2% 605.2 4% 631.0 25% 791.4 Selling, Gen & Adm Exp. 329.8 9% 360.5 10% 394.8 33% 526.5 -5% 499.7 Research & Design 45.8 15% 52.7 14% 59.9 10% 65.9 8% 71.4 Restr & Impair Exp 3.0 80% 5.4 -78% 1.2 2108% 26.5 -52% 12.7 Depreciation Exp.* 36.2 -5% 34.4 0% 34.4 10% 37.8 17% 44.2 Total Operating Exp. 414.8 9% 453.0 8% 490.3 34% 656.7 4% 628.0 EBIT 123.3 12% 137.6 -16% 114.9 -122% (25.7) -736% 163.4 Less Expenses (Income) Interest Expense 19.9 -12% 17.5 -2% 17.2 2% 17.6 -1% 17.5 Interest (Income) (1.5) -33% (1.0) -60% (0.4) n/a (0.4) n/a (0.6) Other Expenses (Income) 2.4 1.6 0.9 0.5 1.3 Net Other Expenses (Incon 20.8 -13% 18.1 -2% 17.7 0% 17.7 3% 18.2 EBT 102.5 17% 119.5 -19% 97.2 - 145% (43.4) 435% 145.2 Taxes & Cum Eff of Act C 31.7 40% 44.3 -35% 29.0 -173% (21.3) -321% 47.1 Net Income 6% 75.2 -9% 68.2 -132% (22.1) -544% 98.1 -2.1% 29.3% 23.8% 7.6% 4.5% 0.8% 0.0% 0.8% 6.8% 2.2% 4.6% 70.8' * Depretiation Expenses are included in the total Selling, General and Administration Expense. In order to calculate Cash Flow you will need to look for the amount of Depreciation Epense by clicking on the Notes to Financial Statements section on Edgar.com. Under the notes section you will click on Supplemental Disclosure of Cash Flow Information to obtian the Depreciation Expense. You will then need to reduce the amount of total Selling, General & Administration Expenses in Cell J9 above to reflect the amount of Depretiation Expense broken out. (See the formula in Cell H9 for example.) FYE ASSETS 5/28/2011 Net Property, Plant, & Equip 169.1 Fixed Assets (Net) 169.1 Goodwill & Intangible Assets 157.9 Other Assets 9.3 Total Assets 808.0 FYE FYE % FYE FYE % of Industry Chng 6/2/2012 Chng 6/1/2013 Chng 5/31/2014 Chng 5/30/2015 Tot Assets Comp -8% 156.0 18% 184.1 6% 1952 28% 249.5 20.9% -8% 156.0 18% 184.1 6% 195.2 28% 249.5 20.9% 16.7% 216.8 337.3 41% 440.6 36.9% 0.0% 18% 11.0 135% 25.8 19% 30.6 28% 39.1 3.3% 7.4% 4% 839.1 13% 946.5 5% 990.9 20% 1192.7 100.0% 100.0% 313.3 F 0.0 0.0 3% 12% 16% 130.1 159.9 5% 6%" 0.0 112.7 153.1 0.0 0.0 265.8 20% 17% 0.0 115.8 137.9 0.0 0.0 253.7 0.0 136.9 169.2 50.0 164.7 198.7 0.0 0.0 363.4 0.0% 13.8% 16.7% 0.0% 0.0% 30.5% 12.5% 18.7% 0.6% 1.3% 8.5% 41.6% -5% 14% 290.0 23% 2% LIABILITIES Notes Payable - Bank Accounts Payable Accruals Current Maturities - LTD Other Current Liabilities Total Current Liabilities Long Term Debt (LTD) Other Liabilities Total Liabilities Redeemable Noncontrolling Common Stock Retained Earnings Accum. Other Comprehen. Additional Paid-In Capital Total Equity 0% 0% 289.8 88.8 742.0 24.3% 7.4% 62.2% 6.7% 7.2% 55.5% -2% 250.0 87.2 603.0 0.0 11.6 218.2 (1068) 82.0 205.0 0% 1% 32% 33% 250.0 0% 87.1 0%" 590.8 6% 0.0 0% 11.7 0% 288.2 15% (142.5) - 11% 90.9 13% 248.3 29% 250.0 -20% 870 -28% 627.0 -1% 0.0 0% 11.7 2% 331.1 -16% (126.2) -69% 102.9 19% 319.5 16% 356.1 200.0 62.7 618.8 0.0 11.9 277.4 (39.6) 122.4 372.1 45% 42% 20% 0% 0% 19% 39% 10% 13% 30.4 11.9 330.2 (55.0) 135.1 4222 2.5% 1.0% 27.7% 4.6% 11.3% 35.4% 21% 44.3% Total Liabilities & Equity 808.0 4% 839.1 13% 946.5 5% 990.9 21% 1194.6 100.2% 100.0%