

Question
please help in this qustion for the following tables all numbers are in usd millions please find 1.compute its liquidty ratios during the years (2019,
please help in this qustion
for the following tables
all numbers are in usd millions
please find
1.compute its liquidty ratios during the years (2019, 2018) : current ratio, quick ratio , put these atios in table for comparison and comment on thier increase or decrease and say why?
2.compute its active ratios during the years (2019, 2018) : inventory turnover,days of inventory outstanding , receivable turnover average collection , average payment period ,cash conversion cycle, total assets turnover , put these ratios in table for comparision and comment on thier increase or decrease and say why?
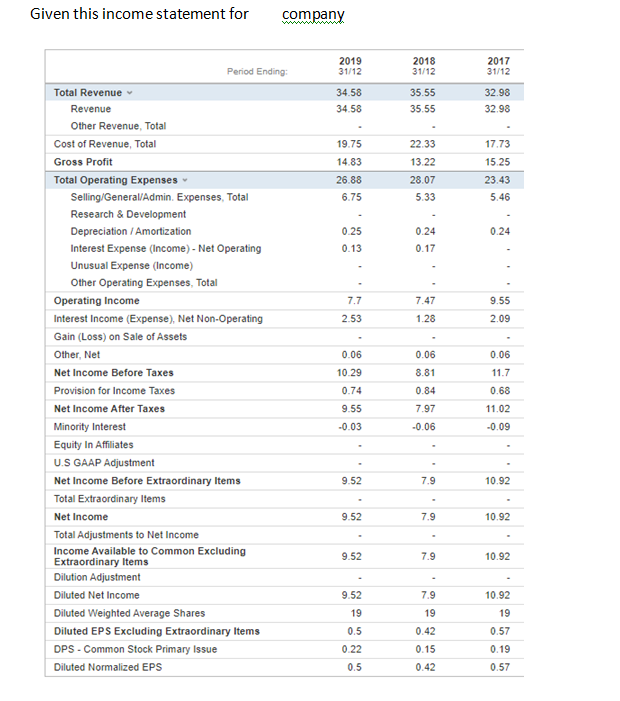
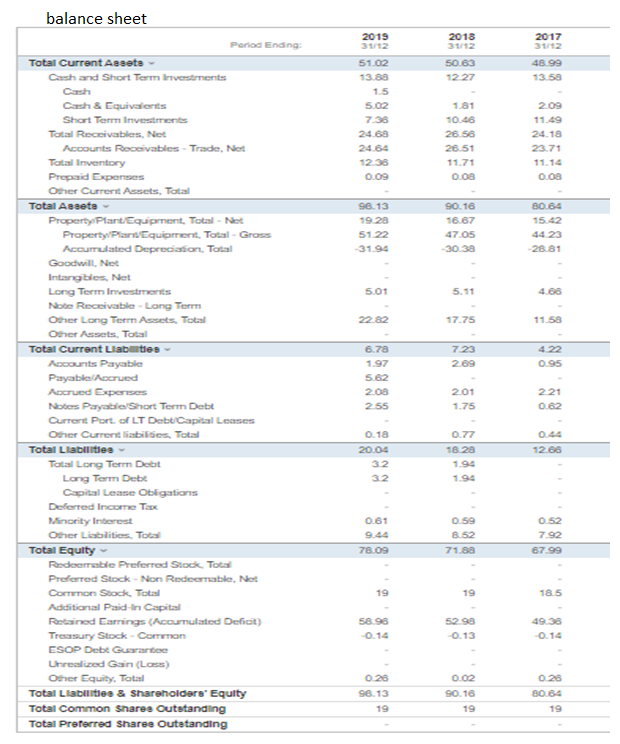
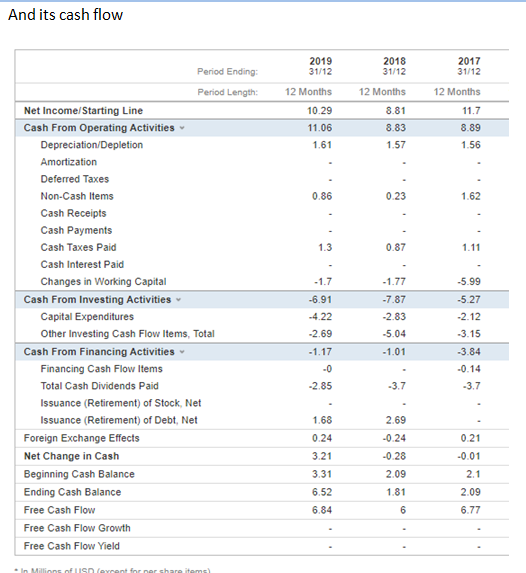
Given this income statement for company 2019 31/12 2018 31/12 2017 31/12 34.58 34.58 35.55 35.55 32.98 32.98 19.75 14.83 26.88 6.75 22.33 13.22 28.07 5.33 17.73 15.25 23.43 5.46 0.24 0.25 0.13 0.24 0.17 7.47 7.7 2.53 9.55 2.09 1.28 0.06 Period Ending: Total Revenue Revenue Other Revenue, Total Cost of Revenue, Total Gross Profit Total Operating Expenses Selling/General/Admin. Expenses, Total Research & Development Depreciation / Amortization Interest Expense (Income) - Net Operating Unusual Expense (Income) Other Operating Expenses, Total Operating Income Interest Income (Expense), Net Non-Operating Gain (Loss) on Sale of Assets Other Net Net Income Before Taxes Provision for Income Taxes Net Income After Taxes Minority Interest Equity In Affiliates U.S GAAP Adjustment Net Income Before Extraordinary Items Total Extraordinary Items Net Income Total Adjustments to Net Income Income Available to Common Excluding Extraordinary Items Dilution Adjustment Diluted Net Income Diluted Weighted Average Shares Diluted EPS Excluding Extraordinary Items DPS - Common Stock Primary Issue Diluted Normalized EPS 0.06 10.29 0.74 8.81 0.06 11.7 0.68 11.02 0.84 7.97 9.55 -0.03 -0.06 -0.09 9.52 7.9 10.92 9.52 7.9 10.92 9.52 7.9 10.92 9.52 7.9 10.92 19 19 0.42 19 0.57 0.5 0.22 0.15 0.19 0.5 0.42 0.57 balance sheet 2018 31/12 Poriad Ending: Total Current Assets Cash and Short Term Investments 2017 31/12 48.99 13.58 50.63 12 27 2019 31/12 51.02 13.88 1.5 5.02 7.38 24.68 24.84 1236 0.09 1.81 10.46 26.56 26.51 11.71 0.08 209 11.49 24.18 23.71 11.14 0.08 96.13 19.28 51.22 31.94 90.16 16.67 47.05 30.38 80.84 15.42 44 23 28.81 5.01 5.11 4.88 2282 17.75 11.58 7.23 2.09 4. 22 0.95 6.78 1.97 5.62 208 255 201 1.75 221 0.62 Cash & Equivalents Short Term Investments Total Receivables, Net Accounts Receivables - Trade, Net Total Inventory Prepaid Expenses Other Current Assets, Total Total Assets Property Plant/Equipment, Total-Net Property Plan Equipment, Total Grass Accurrulated Depreciation. Total Goodwill, Net Intangibles, Net Long Term Investments Note Receivable - Long Term Other Long Term Assets. Total Other resets. Total Total Current Liabetes Accounts Payable Payable/Acrued Accrued Expenses Notes Payable Short Term Debt Current Port of LT Debt Capital Leases Other Current liabilities. Totaal Total Liabilities Total Long Term Debit Long Term Debe Capital Lease Obligations Deferred Income Tax Minority Interest Other Liabilities. To Total Equity Redcerrable Preferred Stock Tots Preferred Stock - Non Redeemable, Net Common Stock Total Additional Paid-In Capital Robined Earrings (Accumulated Deficit) Treasury Stock - Correan CSOP Debt Guarantee Unrealised Gain (Loss) Other Equity, Total Total Liabilities & Shareholders' Equity Total Common Shares Outstanding Total Preferred Sharee Outstanding 0.44 1268 0.18 20.04 32 32 0.77 18 20 1.94 1.90 0.61 0.59 8.52 71.88 0.52 7.92 67.99 78.09 19 19 18.5 58 98 0.14 52 98 -0.13 49.38 -0.14 0.26 96.13 19 0.02 90.16 19 0.26 80.84 19 And its cash flow Period Ending: 2019 31/12 2018 31/12 2017 31/12 12 Months 12 Months 12 Months 10 29 11.06 1.61 8.81 8.83 1.57 11.7 8.89 1.56 0.86 0.23 1.62 1.3 0.87 1.11 -1.7 -5.99 Period Length: Net Income/Starting Line Cash From Operating Activities Depreciation/Depletion Amortization Deferred Taxes Non-Cash Items Cash Receipts Cash Payments Cash Taxes Paid Cash Interest Paid Changes in Working Capital Cash From Investing Activities Capital Expenditures Other Investing Cash Flow Items, Total Cash From Financing Activities Financing Cash Flow Items Total Cash Dividends Paid Issuance (Retirement) of Stock, Net Issuance (Retirement) of Debt, Net Foreign Exchange Effects Net Change in Cash Beginning Cash Balance Ending Cash Balance Free Cash Flow Free Cash Flow Growth Free Cash Flow Yield -6.91 -4.22 -2.69 -1.77 -7.87 -2.83 -5.04 -5.27 -2.12 -3.15 -1.01 -3.84 -1.17 -0 -2.85 -0.14 -3.7 -3.7 1.68 2.69 -0.24 -0.28 0.24 3.21 3.31 6.52 0.21 -0.01 2.1 2.09 1.81 2.09 6.77 6.84 6 incoln evrent or per share items)Step by Step Solution
There are 3 Steps involved in it
Step: 1

Get Instant Access to Expert-Tailored Solutions
See step-by-step solutions with expert insights and AI powered tools for academic success
Step: 2

Step: 3
Ace Your Homework with AI
Get the answers you need in no time with our AI-driven, step-by-step assistance
Get Started
Financial Accounting
Authors: Strayer University
1st Edition
0470603526, 978-0470603529