please help me. Am stuck. Address all the parts clearly
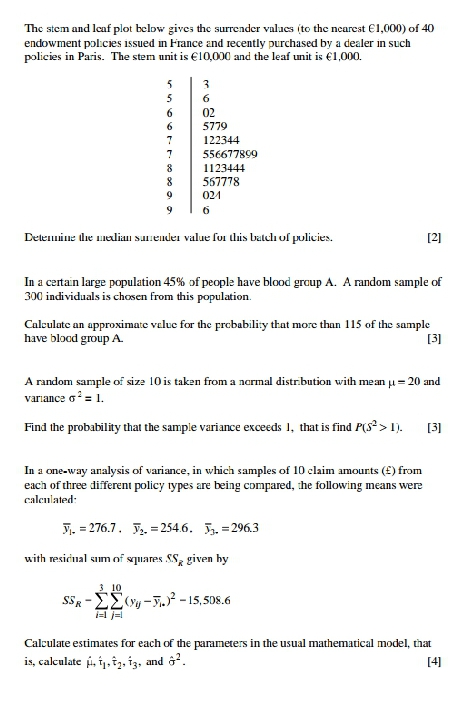
The stem and leaf plot below gives the surrender values (to the nearest (1,000) of 40 endowment policies issued in France and recently purchased by a dealer in such policies in Paris. The stem unit is (10,000 and the leaf unit is (1,000. 6 02 5779 122344 556677899 1123444 567778 021 Delemine die median surender value for this batch of policies. [2] In a certain large population 45% of people have blood group A. A random sample of 300 individuals is chosen from this population. Calculate an approximate value for the probability that more than 115 of the sample have blood group A. [3] A random sample of size 10 is taken from a normal distribution with mean p = 20 and variance 6 * = 1. Find the probability that the sample variance exceeds ], that is find P(S- > 1). [3] In a one-way analysis of variance, in which samples of 10 claim amounts ({) from each of three different policy types are being compared, the following means were calculated: V. = 276.7. V2. =254.6. 5y. =296.3 with residual sum of squares SS, given by SSR - EE(Y-7.) - 15,508.6 Calculate estimates for each of the parameters in the usual mathematical model, that is, calculate , tsty, is, and G-. [4]Give three advantages of the two-state model over the Binomial model for estimating transition intensities where exact dates of entry into and exit from observation are known. [3] Distinguish between the conditions under which a Markov chain: (a) has at least one stationary distribution. (b) has a unique stationary distribution. (c) converges to a unique stationary distribution. [3] Describe the ways in which the design of a model used to project over only a short time frame may differ from one used to project over fifty years. [41 Children at a school are given weekly grade sheets, in which their effort is graded in four levels: 1 "Poor", 2 "Satisfactory", 3 "Good" and 4 "Excellent". Subject to a maximum level of Excellent and a minimum level of Poor, between each week and the next, a child has: a 20 per cent chance of moving up one level. a 20 per cent chance of moving down one level. a 10 per cent chance of moving up two levels. a 10 per cent chance of moving down two levels. Moving up or down three levels in a single week is not possible. (i) Write down the transition matrix of this process. [21 Children are graded on Friday afternoon in each week. On Friday of the first week of the school year, as there is little evidence on which to base an assessment, all children are graded "Satisfactory". Calculate the probability distribution of the process after the grading on Friday of the third week of the school year. [3] [Total 5|