Answered step by step
Verified Expert Solution
Question
1 Approved Answer
please help me answer 11 and 12. 10 Go to the Product Line worksheet, which lists three wind turbines that Four Winds Energy produces and
please help me answer 11 and 12. 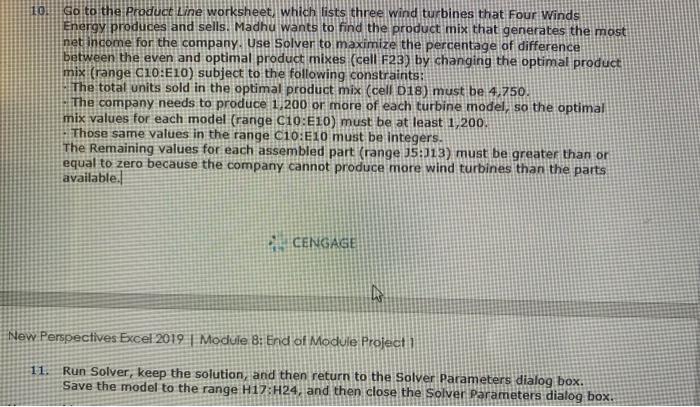
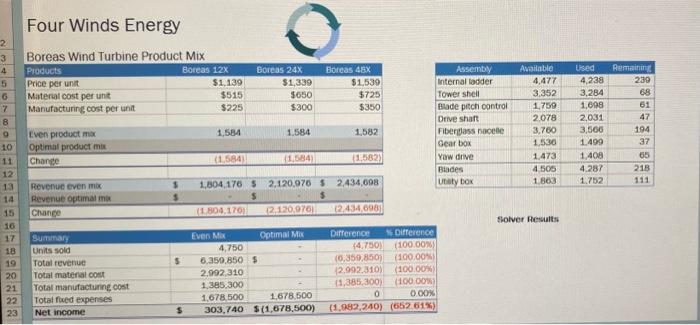
10 Go to the Product Line worksheet, which lists three wind turbines that Four Winds Energy produces and sells. Madhu wants to find the product mix that generates the most net income for the company. Use Solver to maximize the percentage of difference between the even and optimal product mixes (cell F23) by changing the optimal product mix (range C10:E10) subject to the following constraints: The total units sold in the optimal product mix (cell 018) must be 4,750. The company needs to produce 1/200 or more of each turbine model, so the optimal mix values for each model (range Cio:E10) must be at least 1,200. Those same values in the range C10:E10 must be integers. The Remaining values for each assembled part (range 35:13) must be greater than or equal to zero because the company cannot produce more wind turbines than the parts available: CENGAGE New Perspectives Excel 2019 Module 8: End of Module Project 1 11. Run Solver, keep the solution, and then return to the Solver Parameters dialog box. Save the model to the range H17:H24, and then close the Solver Parameters dialog box. Four Winds Energy 2 3 4 5 6 7 B Boreas Wind Turbine Product Mix Products Boreas 12X Price per unit $1.139 Material cost per unit $515 Manufacturing cost per unit $225 Boreas 24 $1,339 $650 $300 Boreas 48X $1,539 $725 $350 Assembly Internal ladder Tower shell Blade pitch control Drive shaft Fiberglass nacelle Gearbox Yow drive Biades Unbox Available 4,477 3,352 1,759 2.078 3.700 1.530 Used 4.238 3,284 1,698 2,031 3,566 1.499 1.409 4.287 1.752 Remaining 230 88 61 47 194 37 65 O 1,584 1.584 1,582 10 Even product ma Optimal product mix Chance (1584 11,584 1.582) 1.473 215 4.505 1863 12 13 14 1,604,1765 111 Revenue even mix Revenue optimal mi Change 5 $ 2,120.976 $ 2,434,098 $ 2.120.970 12434098) (1 804.170 Solver Results $ 10 17 18 19 20 21 22 23 Summary Units sold Total revenue Total material cont Total manufacturing cost Total fed expenses Net Income Even Max Optimal Mi 4,750 6,350,850 $ 2.992,310 1.365.300 1.678.500 1.678.500 303,740 $(1.678.500) Difference Difference 14.750) (100.00%) (0,359,8501 (100.00% 12.092.310) (100.00 11,385,3001 (100.00% 0 0.00% (1.082,240) (652 61%) 10 Go to the Product Line worksheet, which lists three wind turbines that Four Winds Energy produces and sells. Madhu wants to find the product mix that generates the most net income for the company. Use Solver to maximize the percentage of difference between the even and optimal product mixes (cell F23) by changing the optimal product mix (range C10:E10) subject to the following constraints: The total units sold in the optimal product mix (cell 018) must be 4,750. The company needs to produce 1/200 or more of each turbine model, so the optimal mix values for each model (range Cio:E10) must be at least 1,200. Those same values in the range C10:E10 must be integers. The Remaining values for each assembled part (range 35:13) must be greater than or equal to zero because the company cannot produce more wind turbines than the parts available: CENGAGE New Perspectives Excel 2019 Module 8: End of Module Project 1 11. Run Solver, keep the solution, and then return to the Solver Parameters dialog box. Save the model to the range H17:H24, and then close the Solver Parameters dialog box. Four Winds Energy 2 3 4 5 6 7 B Boreas Wind Turbine Product Mix Products Boreas 12X Price per unit $1.139 Material cost per unit $515 Manufacturing cost per unit $225 Boreas 24 $1,339 $650 $300 Boreas 48X $1,539 $725 $350 Assembly Internal ladder Tower shell Blade pitch control Drive shaft Fiberglass nacelle Gearbox Yow drive Biades Unbox Available 4,477 3,352 1,759 2.078 3.700 1.530 Used 4.238 3,284 1,698 2,031 3,566 1.499 1.409 4.287 1.752 Remaining 230 88 61 47 194 37 65 O 1,584 1.584 1,582 10 Even product ma Optimal product mix Chance (1584 11,584 1.582) 1.473 215 4.505 1863 12 13 14 1,604,1765 111 Revenue even mix Revenue optimal mi Change 5 $ 2,120.976 $ 2,434,098 $ 2.120.970 12434098) (1 804.170 Solver Results $ 10 17 18 19 20 21 22 23 Summary Units sold Total revenue Total material cont Total manufacturing cost Total fed expenses Net Income Even Max Optimal Mi 4,750 6,350,850 $ 2.992,310 1.365.300 1.678.500 1.678.500 303,740 $(1.678.500) Difference Difference 14.750) (100.00%) (0,359,8501 (100.00% 12.092.310) (100.00 11,385,3001 (100.00% 0 0.00% (1.082,240) (652 61%) Step by Step Solution
There are 3 Steps involved in it
Step: 1

Get Instant Access to Expert-Tailored Solutions
See step-by-step solutions with expert insights and AI powered tools for academic success
Step: 2

Step: 3
Ace Your Homework with AI
Get the answers you need in no time with our AI-driven, step-by-step assistance
Get Started