Please help me complete this assignment with the proper steps. thank you.
easpl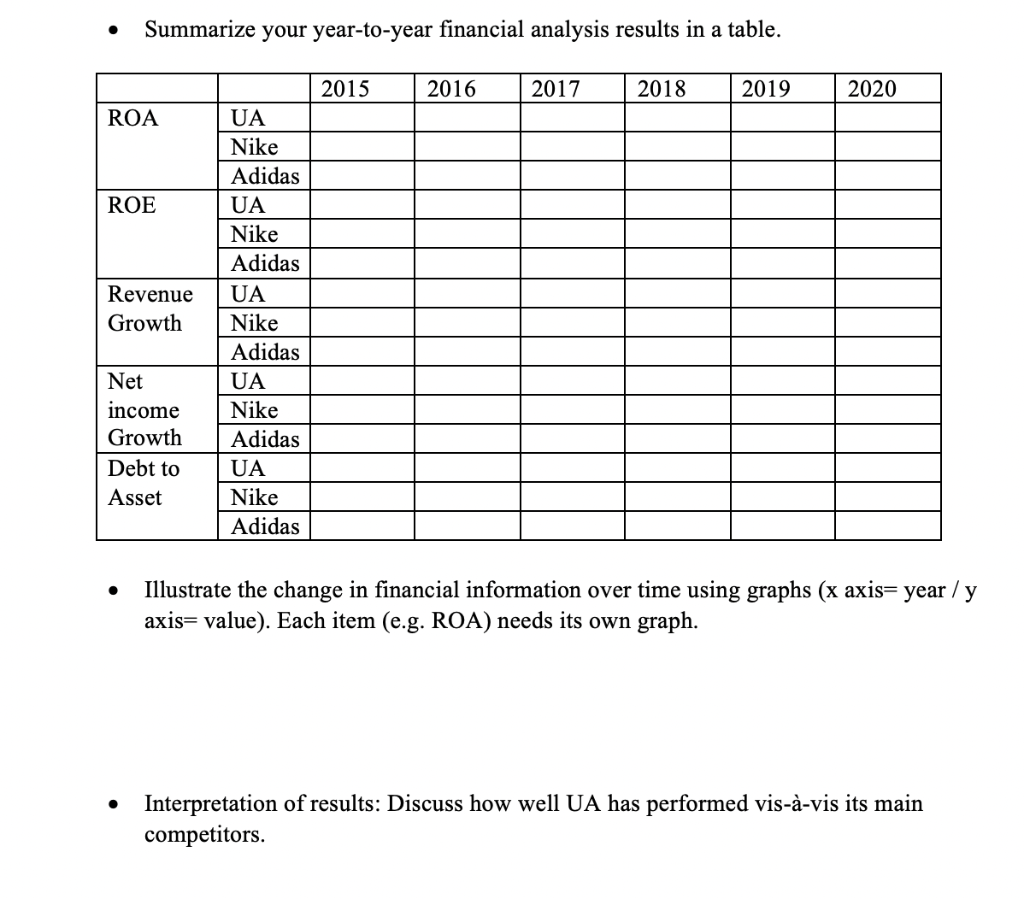
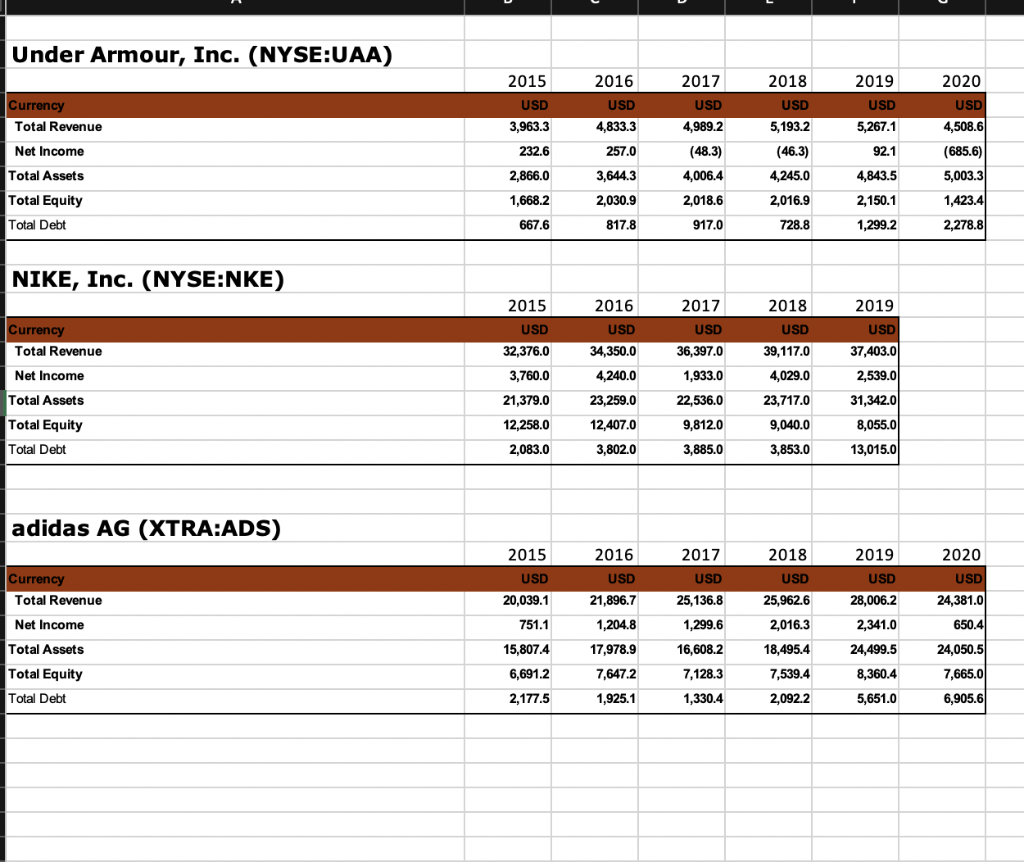
. Summarize your year-to-year financial analysis results in a table. 2015 2016 2017 2018 2019 2020 ROA ROE Revenue Growth UA Nike Adidas UA Nike Adidas UA Nike Adidas UA Nike Adidas UA Nike Adidas Net income Growth Debt to Asset . Illustrate the change in financial information over time using graphs (x axis= year /y axis= value). Each item (e.g. ROA) needs its own graph. Interpretation of results: Discuss how well UA has performed vis--vis its main competitors. Under Armour, Inc. (NYSE:UAA) 2018 2015 USD 3,963.3 2016 USD 4,833.3 Currency Total Revenue 2017 USD 4,989.2 2019 USD USD 2020 USD 4,508.6 (685.6) 5,193.2 5,267.1 Net Income 232.6 257.0 (46.3) 92.1 2,866.0 3,644.3 4,245.0 Total Assets Total Equity Total Debt (48.3) 4,006.4 2,018.6 917.0 1,668.2 2,030.9 2,016.9 4,843.5 2,150.1 1,299.2 5,003.3 1,423.4 2,278.8 667.6 817.8 728.8 NIKE, Inc. (NYSE:NKE) 2015 2017 2018 2019 USD USD USD Currency Total Revenue 2016 USD 34,350.0 4.240.0 39,117.0 36,397.0 1,933.0 22,536.0 4,029.0 32,376.0 3,760.0 21,379.0 12,258.0 USD 37,403.0 2,539.0 31,342.0 8,055.01 Net Income Total Assets Total Equity Total Debt 23,259.0 23,717.0 12,407.0 9,812.0 9,040.0 2,083.0 3,802.0 3,885.0 3,853.0 13,015.0 adidas AG (XTRA:ADS) 2015 2016 2017 2019 2020 USD USD USD Currency Total Revenue 2018 USD 25,962.6 USD 28,006.2 USD 24,381.00 20.039.1 21,896.7 25,136.8 Net Income 751.1 1,204.8 1,299.6 2,016.3 2,341.0 650.4 Total Assets 15,807.4 17,978.9 18,495.4 24,050.5 16,608.2 7,128.3 24,499.5 8,360.4 Total Equity 6,691.2 7,647.2 7,665.0 7,539.4 2,092.2 Total Debt 2,177.5 1,925.1 1,330.4 5,651.0 6,905.6 . Summarize your year-to-year financial analysis results in a table. 2015 2016 2017 2018 2019 2020 ROA ROE Revenue Growth UA Nike Adidas UA Nike Adidas UA Nike Adidas UA Nike Adidas UA Nike Adidas Net income Growth Debt to Asset . Illustrate the change in financial information over time using graphs (x axis= year /y axis= value). Each item (e.g. ROA) needs its own graph. Interpretation of results: Discuss how well UA has performed vis--vis its main competitors. Under Armour, Inc. (NYSE:UAA) 2018 2015 USD 3,963.3 2016 USD 4,833.3 Currency Total Revenue 2017 USD 4,989.2 2019 USD USD 2020 USD 4,508.6 (685.6) 5,193.2 5,267.1 Net Income 232.6 257.0 (46.3) 92.1 2,866.0 3,644.3 4,245.0 Total Assets Total Equity Total Debt (48.3) 4,006.4 2,018.6 917.0 1,668.2 2,030.9 2,016.9 4,843.5 2,150.1 1,299.2 5,003.3 1,423.4 2,278.8 667.6 817.8 728.8 NIKE, Inc. (NYSE:NKE) 2015 2017 2018 2019 USD USD USD Currency Total Revenue 2016 USD 34,350.0 4.240.0 39,117.0 36,397.0 1,933.0 22,536.0 4,029.0 32,376.0 3,760.0 21,379.0 12,258.0 USD 37,403.0 2,539.0 31,342.0 8,055.01 Net Income Total Assets Total Equity Total Debt 23,259.0 23,717.0 12,407.0 9,812.0 9,040.0 2,083.0 3,802.0 3,885.0 3,853.0 13,015.0 adidas AG (XTRA:ADS) 2015 2016 2017 2019 2020 USD USD USD Currency Total Revenue 2018 USD 25,962.6 USD 28,006.2 USD 24,381.00 20.039.1 21,896.7 25,136.8 Net Income 751.1 1,204.8 1,299.6 2,016.3 2,341.0 650.4 Total Assets 15,807.4 17,978.9 18,495.4 24,050.5 16,608.2 7,128.3 24,499.5 8,360.4 Total Equity 6,691.2 7,647.2 7,665.0 7,539.4 2,092.2 Total Debt 2,177.5 1,925.1 1,330.4 5,651.0 6,905.6