 Please help me develop this program in python
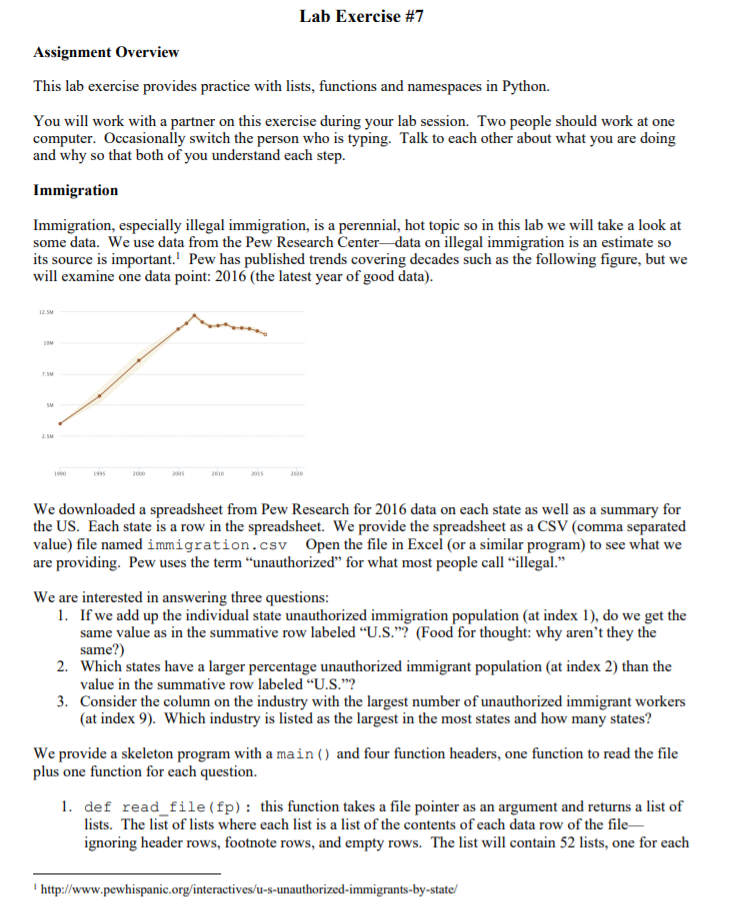
Lab Exercise #7 Assignment Overview This lab exercise provides practice with lists, functions and namespaces in Python. You will work with a partner on this exercise during your lab session. Two people should work at one computer. Occasionally switch the person who is typing. Talk to each other about what you are doing and why so that both of you understand each step Immigration Immigration, especially illegal immigration, is a perennial, hot topic so in this lab we will take a look at some data. We use data from the Pew Research Center- data on illegal immigration is an estimate so its source is important. Pew has published trends covering decades such as the following figure, but we will examine one data point: 2016 (the latest year of good data) We downloaded a spreadsheet from Pew Research for 2016 data on each state as well as a summary for the US. Each state is a row in the spreadsheet. We provide the spreadsheet as a CSV (comma separated value) file named immigration.csv Open the file in Excel (or a similar program) to see what we are providing. Pew uses the term "unauthorized" for what most people call "illegal." We are interested in answering three questions 1. If we add up the individual state unauthorized immigration population (at index 1), do we get the same value as in the summative row labeled "U.S."? (Food for thought: why aren't they the same?) Which states have a larger percentage unauthorized immigrant population (at index 2) than the value in the summative row labeled "U.S."2 Consider the column on the industry with the largest number of unauthorized immigrant workers (at index 9). Which industry is listed as the largest in the most states and how many states? 2. 3. We provide a skeleton program with a main) and four function headers, one function to read the file plus one function for each question 1. def read file (fp): this function takes a file pointer as an argument and returns a list of lists. The list of lists where each list is a list of the contents of each data row of the file ignoring header rows, footnote rows, and empty rows. The list will contain 52 lists, one for each http://www.pewhispanic.org/interactives/u-s-unauthorized-immigrants-by-state/ Lab Exercise #7 Assignment Overview This lab exercise provides practice with lists, functions and namespaces in Python. You will work with a partner on this exercise during your lab session. Two people should work at one computer. Occasionally switch the person who is typing. Talk to each other about what you are doing and why so that both of you understand each step Immigration Immigration, especially illegal immigration, is a perennial, hot topic so in this lab we will take a look at some data. We use data from the Pew Research Center- data on illegal immigration is an estimate so its source is important. Pew has published trends covering decades such as the following figure, but we will examine one data point: 2016 (the latest year of good data) We downloaded a spreadsheet from Pew Research for 2016 data on each state as well as a summary for the US. Each state is a row in the spreadsheet. We provide the spreadsheet as a CSV (comma separated value) file named immigration.csv Open the file in Excel (or a similar program) to see what we are providing. Pew uses the term "unauthorized" for what most people call "illegal." We are interested in answering three questions 1. If we add up the individual state unauthorized immigration population (at index 1), do we get the same value as in the summative row labeled "U.S."? (Food for thought: why aren't they the same?) Which states have a larger percentage unauthorized immigrant population (at index 2) than the value in the summative row labeled "U.S."2 Consider the column on the industry with the largest number of unauthorized immigrant workers (at index 9). Which industry is listed as the largest in the most states and how many states? 2. 3. We provide a skeleton program with a main) and four function headers, one function to read the file plus one function for each question 1. def read file (fp): this function takes a file pointer as an argument and returns a list of lists. The list of lists where each list is a list of the contents of each data row of the file ignoring header rows, footnote rows, and empty rows. The list will contain 52 lists, one for each http://www.pewhispanic.org/interactives/u-s-unauthorized-immigrants-by-state/