PLEASE HELP ME: ENVIRONMENTAL ECONOMICS
4. Suppose the researchers estimated demand curves from the CVM questionnaire illustrated in the chapter. Show graphically and explain how these demand curves would measure WTP for improving air quality for each of the scenarios.


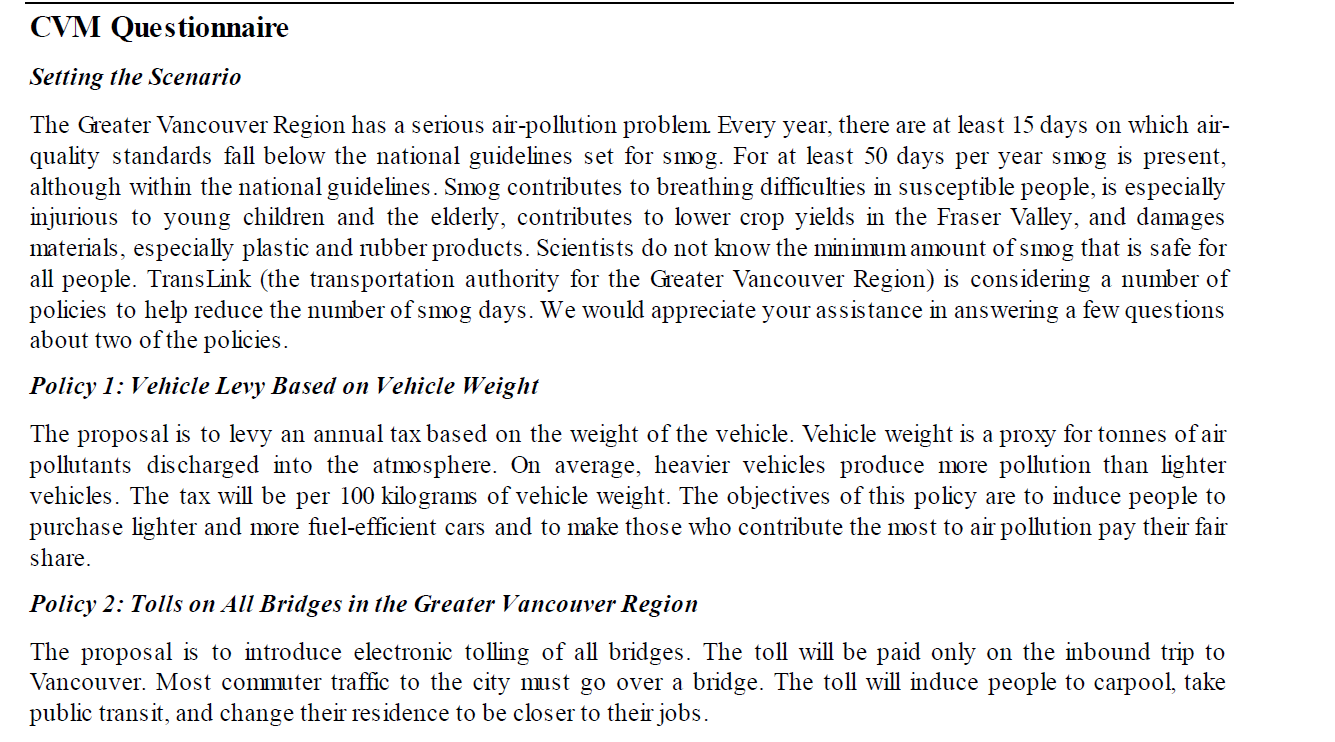
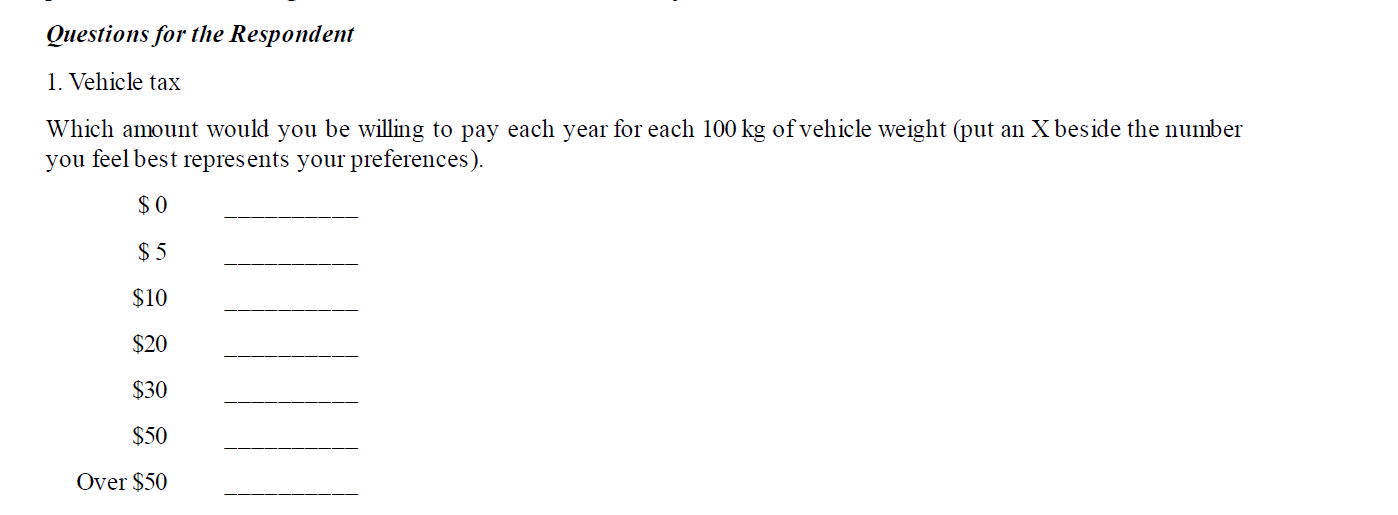
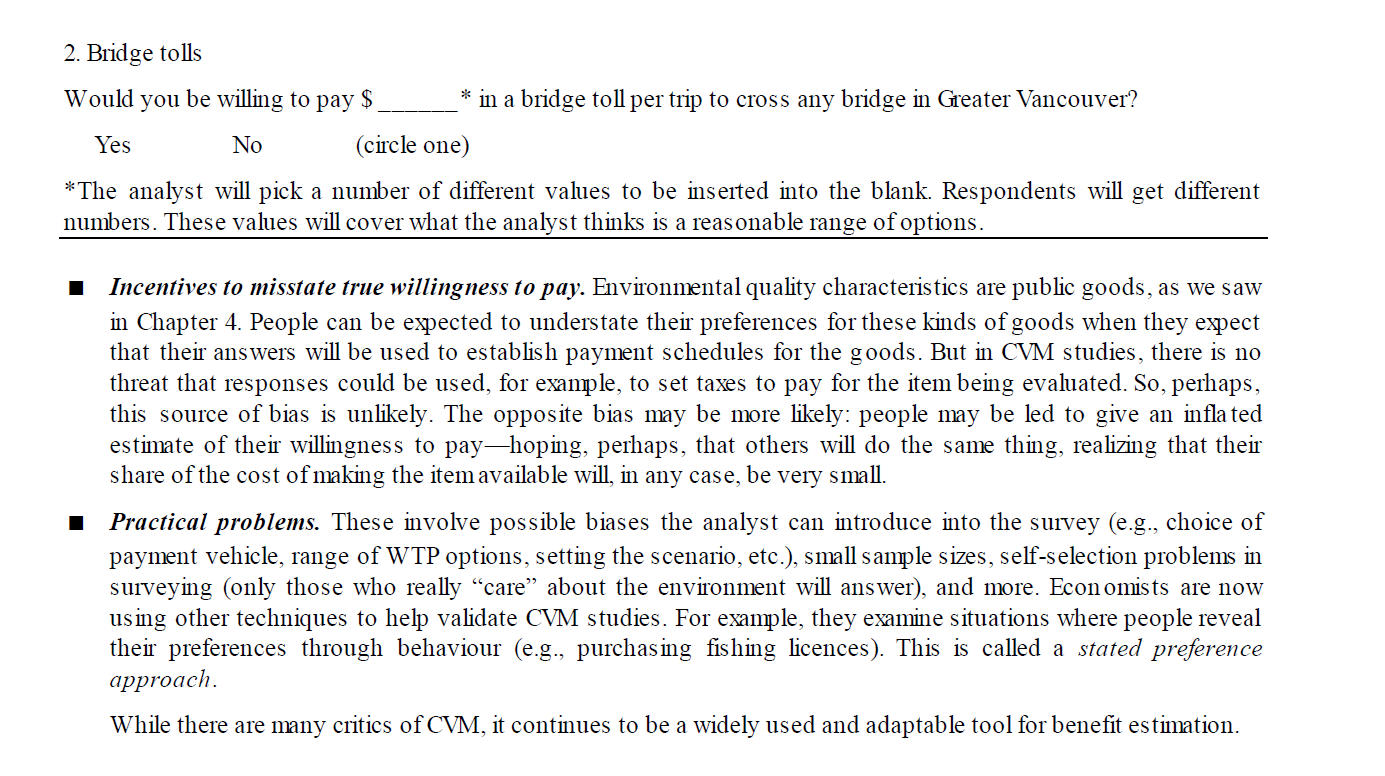
Setting the Scenario The Greater Vancouver Region has a serious air-pollution problem Every year, there are at least 15 days on which airquality standards fall below the national guidelines set for smog. For at least 50 days per year smog is present, although within the national guidelines. Smog contributes to breathing difficulties in susceptible people, is especially injurious to young children and the elderly, contributes to lower crop yields in the Fraser Valley, and damages materials, especially plastic and rubber products. Scientists do not know the minimum amount of smog that is safe for all people. TransLink (the transportation authority for the Greater Vancouver Region) is considering a number of policies to help reduce the number of smog days. We would appreciate your assistance in answering a few questions about two of the policies. Policy 1: Vehicle Levy Based on Vehicle Weight The proposal is to levy an annual tax based on the weight of the vehicle. Vehicle weight is a proxy for tonnes of air pollutants discharged into the atmosphere. On average, heavier vehicles produce more pollution than lighter vehicles. The tax will be per 100 kilograms of vehicle weight. The objectives of this policy are to induce people to purchase lighter and more fuel-efficient cars and to make those who contribute the most to air pollution pay their fair share. Policy 2: Tolls on All Bridges in the Greater Vancouver Region The proposal is to introduce electronic tolling of all bridges. The toll will be paid only on the inbound trip to Vancouver. Most commuter traffic to the city must go over a bridge. The toll will induce people to carpool, take public transit, and change their residence to be closer to their jobs. Questions for the Respondent 1. Vehicle tax Which amount would you be willing to pay each year for each 100kg of vehicle weight (put an X beside the number you feel best represents your preferences). 2. Bridge tolls Would you be willing to pay $ in a bridge toll per trip to cross any bridge in Greater Vancouver? Yes No (circle one) *The analyst will pick a number of different values to be inserted into the blank. Respondents will get different numbers. These values will cover what the analyst thinks is a reasonable range of options. Incentives to misstate true willingness to pay. Environmental quality characteristics are public goods, as we saw in Chapter 4. People can be expected to understate their preferences for these kinds of goods when they expect that their answers will be used to establish payment schedules for the goods. But in CVM studies, there is no threat that responses could be used, for example, to set taxes to pay for the item being evaluated. So, perhaps, this source of bias is unlikely. The opposite bias may be more likely: people may be led to give an inflated estimate of their willingness to pay-hoping, perhaps, that others will do the same thing, realizing that their share of the cost of making the item available will, in any case, be very small. - Practical problems. These involve possible biases the analyst can introduce into the survey (e.g., choice of payment vehicle, range of WTP options, setting the scenario, etc.), small sample sizes, self-selection problems in surveying (only those who really "care" about the environment will answer), and more. Economists are now using other techniques to help validate CVM studies. For example, they examine situations where people reveal their preferences through behaviour (e.g., purchasing fishing licences). This is called a stated preference approach. While there are many critics of CVM, it continues to be a widely used and adaptable tool for benefit estimation


