Answered step by step
Verified Expert Solution
Question
1 Approved Answer
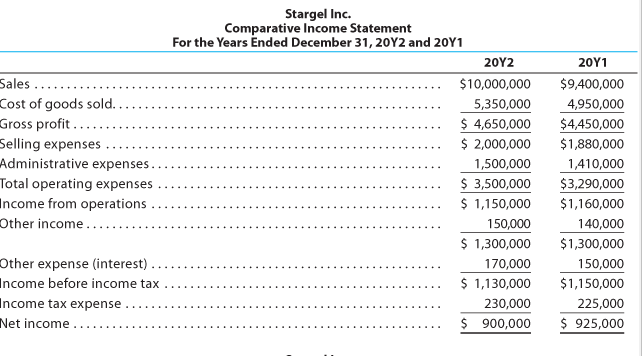
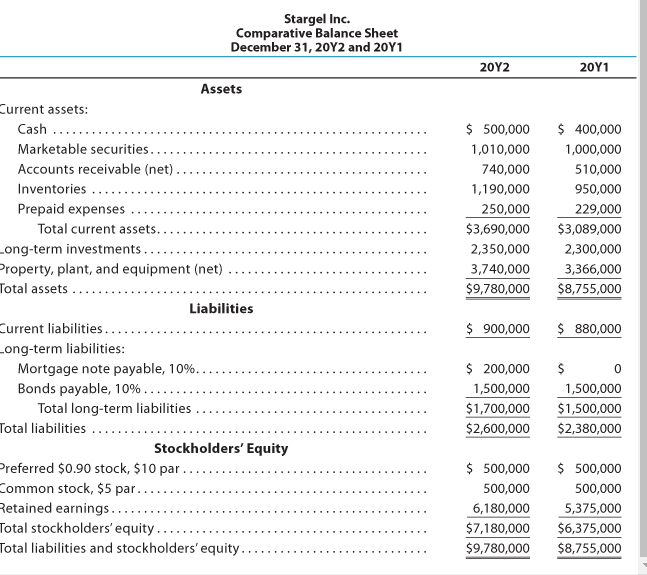
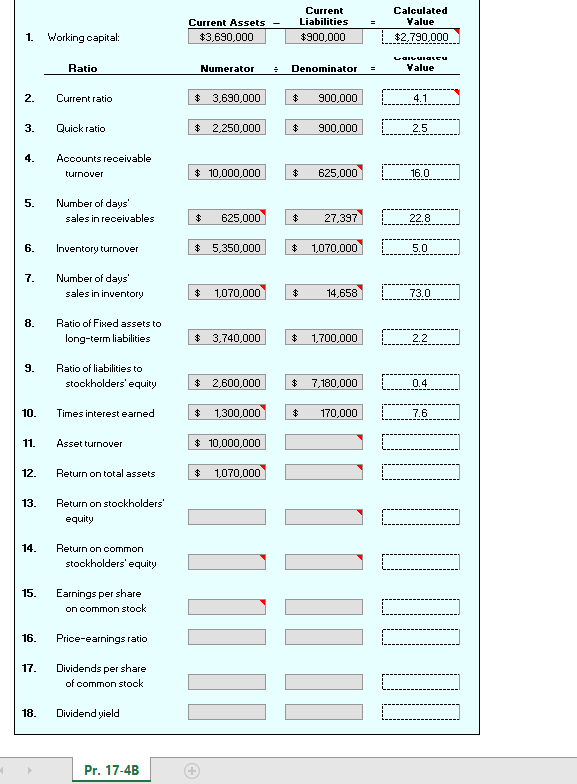
Please help me figure this out. I need help with problems 11-18 the picture of the income statement and balance sheet is supposed to help


Please help me figure this out. I need help with problems 11-18 the picture of the income statement and balance sheet is supposed to help find the total to each one on this excel sheet. Please Do Not Write in Cursive Print Only Must have Good Penmanship.
Sales .... Cost of goods sold. Gross profit... Selling expenses Administrative expenses Total operating expenses Income from operations Other income... Stargel Inc. Comparative Income Statement For the Years Ended December 31, 20Y2 and 2041 20Y2 $10,000,000 5,350,000 $ 4,650,000 $ 2,000,000 1,500,000 $ 3,500,000 $ 1,150,000 150,000 $ 1,300,000 170,000 $ 1,130,000 230,000 $ 900,000 20Y1 $9,400,000 4,950,000 $4,450,000 $1,880,000 1,410,000 $3,290,000 $1,160,000 140,000 $1,300,000 150,000 $1,150,000 225,000 $ 925,000 Other expense (interest) Income before income tax Income tax expense Net income... Stargel Inc. Comparative Balance Sheet December 31, 2012 and 2041 2012 20Y1 $ 500,000 1,010,000 740,000 1,190,000 250,000 $3,690,000 2,350,000 3,740,000 $9,780,000 $ 400,000 1,000,000 510,000 950,000 229,000 $3,089,000 2,300,000 3,366,000 $8,755,000 Assets Current assets: Cash Marketable securities... Accounts receivable (net). Inventories ... Prepaid expenses Total current assets.. Long-term investments Property, plant, and equipment (net) Total assets Liabilities Current liabilities... Long-term liabilities: Mortgage note payable, 10%.. Bonds payable, 10%.... Total long-term liabilities Total liabilities ... Stockholders' Equity Preferred $0.90 stock, $10 par Common stock, $5 par.... Retained earnings.... Total stockholders' equity... Total liabilities and stockholders' equity. $ 900,000 $ 880,000 $ 200,000 1,500,000 $1,700,000 $2,600,000 $ 0 1,500,000 $1,500,000 $2,380,000 $ 500,000 500,000 6,180,000 $7,180,000 $9,780,000 $ 500,000 500,000 5,375,000 $6,375,000 $8,755,000 Current Assets $3,690,000 Current Liabilities $900,000 Calculated Value $2,790,000 1. Working capital: Ratio Numerator Denominator LaLuIalcu Value 2. Current ratio $ 3,690,000 $ 900,000 4.1 3. Quick ratio $ 2,250,000 $ 900,000 2.5 4. Accounts receivable turnover $ 10,000,000 $ 625,000 16.0 5. Number of days sales in receivables $ 625,000 $ 27,397 22.8 6. Inventory turnover $ 5,350,000 $ 1,070,000 5.0 7. Number of days' sales in inventory $ 1,070,000 $ 14,658 73.0 8. Ratio of Fixed assets to long-term liabilities $ 3,740,000 $ 1,700,000 2.2 9. Ratio of liabilities to stockholders' equity $ 2,600,000 $ 7,180,000 0.4 10 Times interest earned $ 1,300,000 $ 170,000 7.6 11. Asset turnover $ 10,000,000 12. Return on total assets $ 1,070,000 13. Return on stockholders' equity 14. Return on common stockholders' equity 15. . Earnings per share on common stock ITION 16. Price-earnings ratio 17. Dividends per share of common stock 18. Dividend yield Pr. 17-4B +Step by Step Solution
There are 3 Steps involved in it
Step: 1

Get Instant Access to Expert-Tailored Solutions
See step-by-step solutions with expert insights and AI powered tools for academic success
Step: 2

Step: 3

Ace Your Homework with AI
Get the answers you need in no time with our AI-driven, step-by-step assistance
Get Started


