

Answered step by step
Verified Expert Solution
Question
1 Approved Answer
please help me fill in blanks thank you FIFO LIFO weight avg. need help on specufic ID Date # of units sold por unit of
please help me fill in blanks thank you 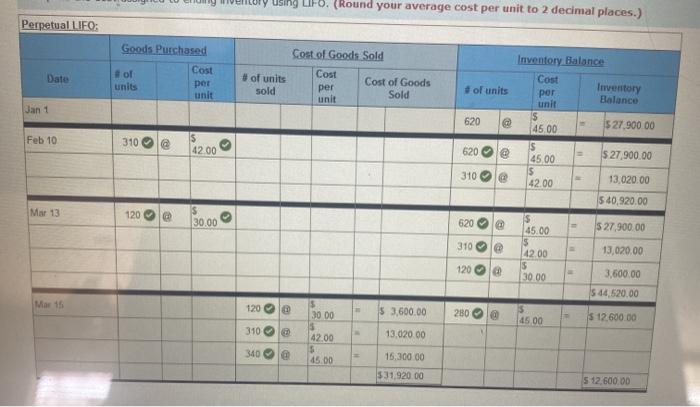
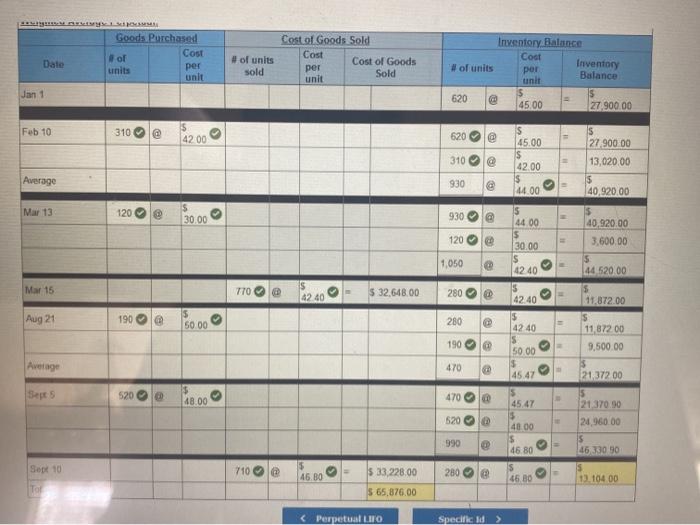
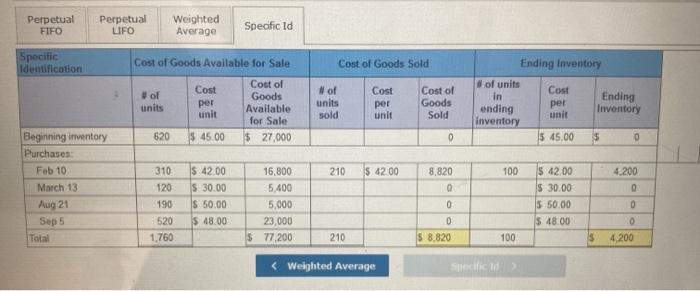
Date # of units sold por unit of units Cost of Goods Sold units per unit mventory Balance Jan 1 620 BD por unit 5 45.00 Is 45.00 $ 42.00 Feb 10 310 @ 620 42.00 . @ 310 > 27 900.00 $ 27,900.00 13,020.00 $ 40.920.00 $ 27,900.00 13.020.00 Mar 13 120 @ 620 30.00 310 0 $ 45.00 $ 42.00 S 30.00 120 @ 3,600.00 5 44.520.00 s 13.020.00 3600.00 Mar 15 620 er $ 27,900.00 310 08 5 45.00 $ 42.00 3 > 5 42.00 $ 30.00 150 > 6,300.00 120 $ 34,200.00 5 16,620 00 Aug 21 190 o 150 $ 6,720.00 50.00 S 42.00 > 120 3,600.00 30.00 1900 9 500 00 50.00 19,820.09 y using LIFO. (Round your average cost per unit to 2 decimal places.) Perpetual LIFO: Cost of Goods Sold Goods Purchased # of Cost units per unit Date #of units sold Cost per unit Cost of Goods Sold of units Inventory Balance Cost por Inventory unit Balance $ 4500 $ 27,900.00 Jan 1 620 @ Feb 10 310 42.00 620 @ $ 27,900.00 S 45.00 IS 42.00 310 13.020.00 $ 40,920.00 Mar 13 so 120 30.00 620 $ 27,900.00 310 45.00 $ 42.00 5 3000 13,020,00 120 3,600.00 $ 44,520.00 Mar 15 120 30 00 5 3.600.00 280 4500 $ 12,600.00 310 42.00 13.020.00 340 5 45.00 15,300.00 $31.920.00 5 12,600.00 BUSCA Goods Purchased of Cost Date per units unt #ol units Cost of Goods Sold Cost Cost of Goods per Sold unit Inventory Balance Coot Inventory of units por Balance sold Jan 1 620 @ 4500 27 900.00 Feb 10 310 @ 4200 620 310 $ 45.00 S 42.00 $ 44.00 Is 27 900 00 13,020.00 S 40,920.00 Average 930 Mar 13 120 30.00 930 s 44.00 5 30.00 40,920.00 3,600.00 120 9 1,050 44.520.00 Mar 15 770 @ $ 32,648.00 280 42.40 @ 4240 IS 42.40 $ 42 40 > 5 11.872.00 Aug 21 190 50 00 280 = 190 > S Average 470 5 11872.00 9,500.00 $ 21.372.00 5 21.370.90 24,960.00 s 46 330 50 50.00 $ 45.47 5 45 47 $ 4000 520 @ 470 48.00 5 520 o e 990 46.80 Sep 10 710 @ 280 . 46.80 $ 33, 228,00 $ 65,876.00 45.00 13.10400 Tol Perpetual FIFO Perpetual LIFO Weighted Average Specfic ld Specific Identification Cost of Goods Available for Sale Cost of Goods Sold #of units Cost per unit Cost of Goods Available for Sale $ 27,000 #of units sold Cost per unit Cost of Goods Sold Ending Inventory of units Cost in Ending ending per unit Inventory inventory $ 45,00 5 0 620 $ 45.00 0 210 $ 42.00 100 Beginning inventory Purchases Feb 10 March 13 Aug 21 Sep 5 Total 310 120 $ 42.00 $ 30.00 $ 50,00 $ 48.00 16,800 5,400 5,000 23,000 $ 77,200 8.820 0 0 $ 42.00 $ 30.00 S 50.00 $18.00 190 4,200 0 0 0 4,200 520 1.760 D $ 8.820 210 100 5 27 900.00 $ 27,900.00 13,020.00 $ 40.920.00 $ 27,900.00 13.020.00 Mar 13 120 @ 620 30.00 310 0 $ 45.00 $ 42.00 S 30.00 120 @ 3,600.00 5 44.520.00 s 13.020.00 3600.00 Mar 15 620 er $ 27,900.00 310 08 5 45.00 $ 42.00 3 > 5 42.00 $ 30.00 150 > 6,300.00 120 $ 34,200.00 5 16,620 00 Aug 21 190 o 150 $ 6,720.00 50.00 S 42.00 > 120 3,600.00 30.00 1900 9 500 00 50.00 19,820.09 y using LIFO. (Round your average cost per unit to 2 decimal places.) Perpetual LIFO: Cost of Goods Sold Goods Purchased # of Cost units per unit Date #of units sold Cost per unit Cost of Goods Sold of units Inventory Balance Cost por Inventory unit Balance $ 4500 $ 27,900.00 Jan 1 620 @ Feb 10 310 42.00 620 @ $ 27,900.00 S 45.00 IS 42.00 310 13.020.00 $ 40,920.00 Mar 13 so 120 30.00 620 $ 27,900.00 310 45.00 $ 42.00 5 3000 13,020,00 120 3,600.00 $ 44,520.00 Mar 15 120 30 00 5 3.600.00 280 4500 $ 12,600.00 310 42.00 13.020.00 340 5 45.00 15,300.00 $31.920.00 5 12,600.00 BUSCA Goods Purchased of Cost Date per units unt #ol units Cost of Goods Sold Cost Cost of Goods per Sold unit Inventory Balance Coot Inventory of units por Balance sold Jan 1 620 @ 4500 27 900.00 Feb 10 310 @ 4200 620 310 $ 45.00 S 42.00 $ 44.00 Is 27 900 00 13,020.00 S 40,920.00 Average 930 Mar 13 120 30.00 930 s 44.00 5 30.00 40,920.00 3,600.00 120 9 1,050 44.520.00 Mar 15 770 @ $ 32,648.00 280 42.40 @ 4240 IS 42.40 $ 42 40 > 5 11.872.00 Aug 21 190 50 00 280 = 190 > S Average 470 5 11872.00 9,500.00 $ 21.372.00 5 21.370.90 24,960.00 s 46 330 50 50.00 $ 45.47 5 45 47 $ 4000 520 @ 470 48.00 5 520 o e 990 46.80 Sep 10 710 @ 280 . 46.80 $ 33, 228,00 $ 65,876.00 45.00 13.10400 Tol Perpetual FIFO Perpetual LIFO Weighted Average Specfic ld Specific Identification Cost of Goods Available for Sale Cost of Goods Sold #of units Cost per unit Cost of Goods Available for Sale $ 27,000 #of units sold Cost per unit Cost of Goods Sold Ending Inventory of units Cost in Ending ending per unit Inventory inventory $ 45,00 5 0 620 $ 45.00 0 210 $ 42.00 100 Beginning inventory Purchases Feb 10 March 13 Aug 21 Sep 5 Total 310 120 $ 42.00 $ 30.00 $ 50,00 $ 48.00 16,800 5,400 5,000 23,000 $ 77,200 8.820 0 0 $ 42.00 $ 30.00 S 50.00 $18.00 190 4,200 0 0 0 4,200 520 1.760 D $ 8.820 210 100 5 FIFO 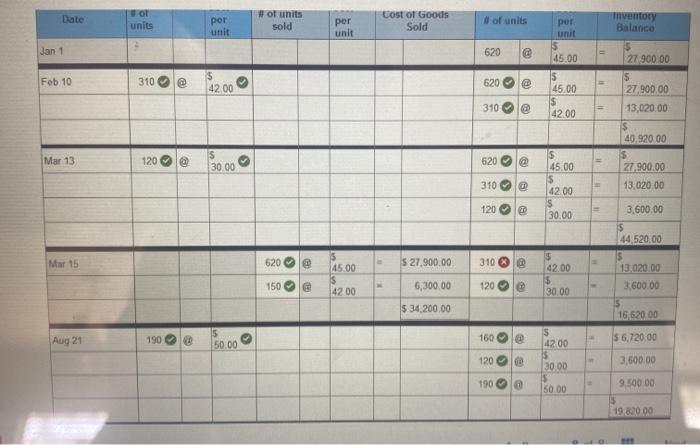
LIFO
weight avg.
need help on specufic ID
Step by Step Solution
There are 3 Steps involved in it
Step: 1

Get Instant Access to Expert-Tailored Solutions
See step-by-step solutions with expert insights and AI powered tools for academic success
Step: 2

Step: 3
Ace Your Homework with AI
Get the answers you need in no time with our AI-driven, step-by-step assistance
Get Started
SEO Competitor Audit Journal
Authors: Nelz Plummer
1st Edition
B09DDWJGRC, 979-8459748123