Please help me fill in this chart with all work included. I will rate positive !!!


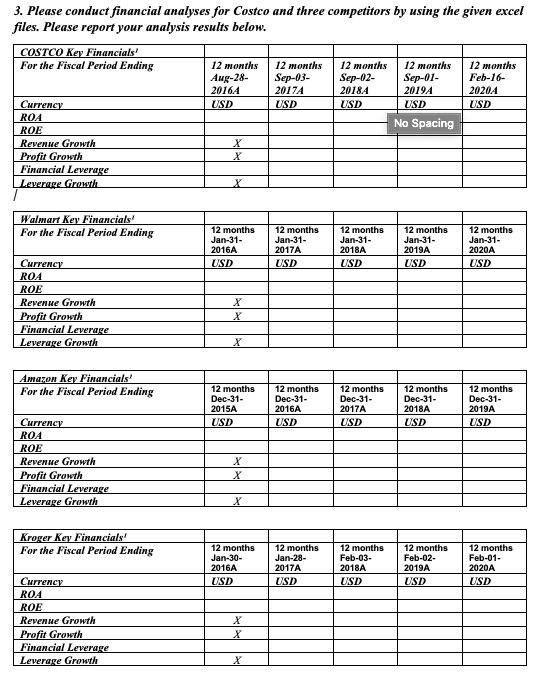
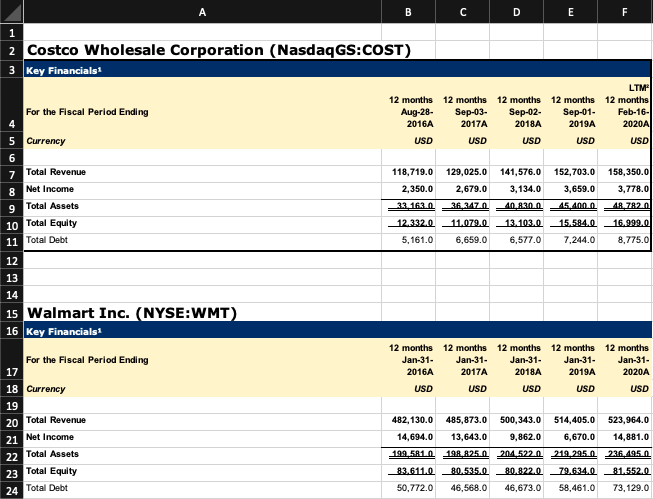
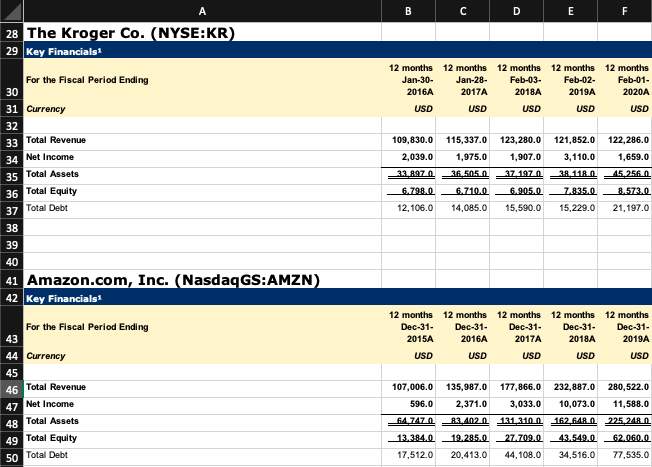
3. Please conduct financial analyses for Costco and three competitors by using the given excel files. Please report your analysis results below. COSTCO Key Financials' For the Fiscal Period Ending 12 months 12 months 12 months 12 months 12 months Aug-28 Sep-03 Sep-02 Sep-01 Feb-16- 20164 2017A 2018A 20194 20204 Currency USD USD USD USD USD ROA No Spacing ROE Revenue Growth Profit Growth Financial Leverage Leverage Growth X Walmart Key Financials For the Fiscal Period Ending 12 months Jan-31- 2016A USD 12 months Jan-31- 2017A USD 12 months Jan-31- 2018A USD 12 months Jan-31- 2019A USD 12 months Jan-31- 2020A USD Currency ROA ROE Revenue Growth Profit Growth Financial Leverage Leverage Growth X Amazon Key Financials For the Fiscal Period Ending 12 months Dec-31- 2015A USD 12 months Dec-31- 2016A USD 12 months Dec-31- 2017A USD 12 months Dec-31- 2018A USD 12 months Dec-31- 2019A USD Currency ROA ROE Revenue Growth Profit Growth Financial Leverage Leverage Growth Kroger Key Financials! For the Fiscal Period Ending 12 months Jan-30- 2016A USD 12 months Jan-28- 2017A USD 12 months Feb-03- 2018A USD 12 months Feb-02- 2019A USD 12 months Feb-01 - 2020A USD Currency ROA ROE Revenue Growth Profit Growth Financial Leverage Leverage Growth X B C D E F 1 2 Costco Wholesale Corporation (Nasdaq GS:COST) 3 Key Financials: 12 months 12 months Aug-28 Sep-03- 2016A 2017A USD USD 12 months 12 months Sep-02 Sep-01- 2018A 2019A USD USD LTM 12 months Feb-16- 2020A USD For the Fiscal Period Ending 4 5 Currency 6 7 Total Revenue 8 Net Income 9 Total Assets 10 Total Equity 11 Total Debt 118,719.0 2,350.0 141,576.0 3,134.0 152,703.0 3,659.0 129,025.0 2,679.0 36.347.0 11.079.0 6.659.0 158,350.0 3,778.0 48.782.0 33.162.0 40.8.300 45.400 12.332.0 5,161.0 13.103.0 6,577.0 15.584.0 7,244.0 16.999.0 8.775.0 12 13 14 15 Walmart Inc. (NYSE:WMT) 16 Key Financials: 12 months Jan-31- 2016A 12 months Jan-31- 2017A 12 months 12 months Jan-31 Jan-31- 2018A 2019A USD USD 12 months Jan-31- 2020A USD USD USD For the Fiscal Period Ending 17 18 Currency 19 20 Total Revenue 21 Net Income 22 Total Assets 23 Total Equity 24 Total Debt 482,130.0 14,694.0 485,873.0 13,643.0 198.825.0 80.535.0 46,568.0 500,343.0 514,405.0 9,862.0 6,670.0 204.522.0 219.295.0 199.581.0 523,964.0 14,881.0 23.6.195.0 81.552.0 73,129.0 80.822.0 79.634.0 83.611.0 50,772.0 46,673.0 58,461.0 A B C D E F 28 The Kroger Co. (NYSE:KR) 29 Key Financials: 12 months 12 months Jan-30 Jan-28- 2016A 2017A USD USD 12 months 12 months 12 months Feb-03 Feb-02 Feb-01- 2018A 2019A 2020A USD USD USD 123,280.0 109,830.0 2,039.0 115,337.0 1,975.0 36.505.0 121,852.0 3,110.0 122,286.0 1,659.0 1,907.0 33.897.1 37.197.0 38.118_n 45.255 For the Fiscal Period Ending 30 31 Currency 32 33 Total Revenue 34 Net Income 35 Total Assets 36 Total Equity 37 Total Debt 38 39 40 41 Amazon.com, Inc. (Nasdaq GS:AMZN) 42 Key Financials: 6.9050 7.835.0 6.798.0 12, 106.0 6.710.0 14,085.0 8.573.0 21, 197.0 15,590.0 15,229.0 12 months Dec-31- 2015A USD 12 months 12 months 12 months Dec-31 Dec-31 Dec-31- 2016A 2017A 2018A USD USD USD 12 months Dec-31- 2019A USD For the Fiscal Period Ending 43 44 Currency 45 46 Total Revenue 47 Net Income 48 Total Assets 49 Total Equity 50 Total Debt 135,987.0 177,866.0 2,371.0 3,033.0 107,006.0 596.0 64.747.0 13.384.0 17,512.0 1313100 83.402.0 19.285.0 20,413.0 232,887.0 280,522.0 10,073.0 11,588.0 162.148.0 225,241 43.549.0 62.060.0 34,516.0 77,535.0 27 7090 44, 108.0


