

Question
Please help me fill this chart out and draw a bar graph or histogram on the amounts with respect to elements. The y-axis to be
Please help me fill this chart out 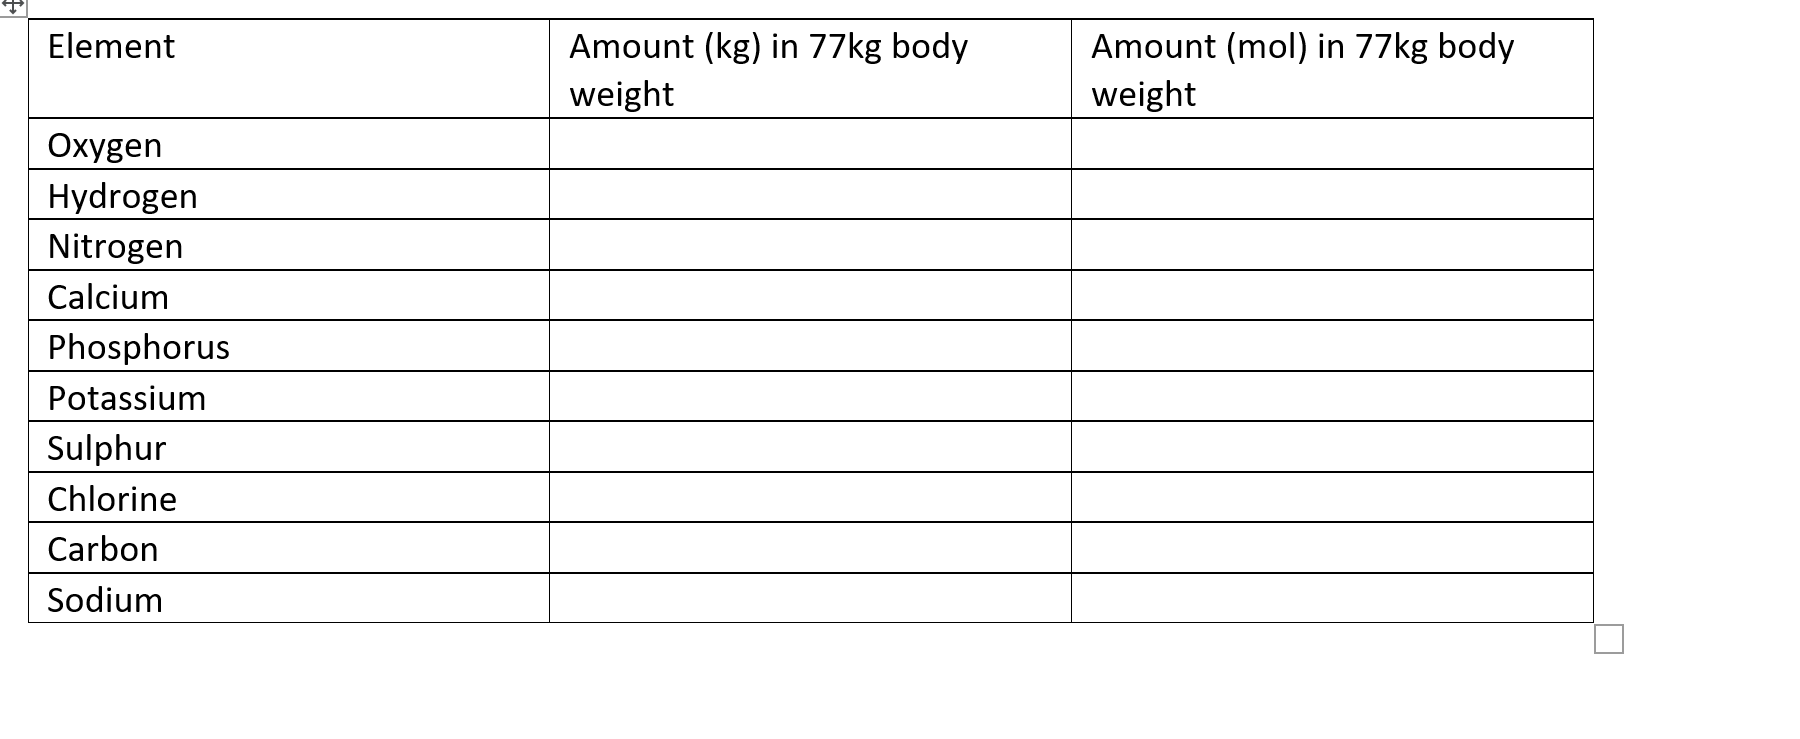 and draw a bar graph or histogram on the amounts with respect to elements. The y-axis to be the amount of element and x-axis to be the name of element.
Step by Step Solution
There are 3 Steps involved in it
Step: 1

Get Instant Access to Expert-Tailored Solutions
See step-by-step solutions with expert insights and AI powered tools for academic success
Step: 2

Step: 3
Ace Your Homework with AI
Get the answers you need in no time with our AI-driven, step-by-step assistance
Get Started
Fundamentals of Analytical Chemistry
Authors: Douglas A. Skoog, Donald M. West, F. James Holler, Stanley R. Crouch
9th edition
495558281, 978-0495558286