Answered step by step
Verified Expert Solution
Link Copied!

Question

1 Approved Answer

Please help me find the mainainance cost per Kw (A40) and Total Maint Cost (Based on 15kW) for years 1 through 30 P Q R

Please help me find the mainainance cost per Kw (A40) and Total Maint Cost (Based on 15kW) for years 1 through 30image text in transcribed

P Q R S T U Y W Y Z AA A A B D E F G . J K L M N o 1 Exhibit TN2 2 WELLS FARGO: SOLAR ENERGY FOR LOS ANGELES BRANCHES (A) AND (B) 3 Pro Forma Economic Model 4 5 In the cells below the "Assumptions for Case" are formulas for key variables in column B starting with B35 and rows 71 - 74. Do not modify these cells. 6 You are to enter the formulas only in the cells that are shaded: 7 7 8 Assumptions for Case: 9 9 Size, kW 15 kW 10 cost per kW $7,000 $ per kW Total cost $ 105,000.00 11 Efficienoy rating 18% % end-of-life salva 15% 12 annual degradation 0.50% % value to depreci $ 89,250,00 13 14 SIP rate $1.95 per W 15 system rating 12585 W Notes: 16 design factor 0.9 1) Electricity generation for year 1 is in cell B36 based on a formula in that cell. 17 For each succeeding year electricity generation declines by 0.5%, as stated in the case. 18 tax rate 38% of profits 2) The hurdle rate or discount rate is in cell B30 and is based on an after-tax rate, since all of the 19 tax credit 30% of system oost cash flows are adjusted for taxes. 20 3) The formula for the Solar Incentive Program (SIP) is in cell B64. 21 Electricity cost $0.17 per kWh 4) Total cash flow for the payback method is the formula in cell B71. 22 annual increase 37 5) Number of years for payback is in cell B74. 23 6) Initially assume straight line depreciation over 5 years; in question 3) you will use accelerated depreciation based on MACRS. 24 maintainance $15 per kW 25 annual increase 274 26 27 insurance 0.30% of total cost 28 annual increase 27. 29 30 discount rate 3.53% 31 32 33 year 34 1, 2 3 4 5 6 7 8 9 10 11 12 13 14 35 electricity cost $0.17 $0.18 $0.18 $0.19 $0.19 $0.20 $0.20 $0.21 $0.22 $0.22 $0.23 $0.24 $0.24 $0.25 36 electricity generation kW 23652 23533.74 23416.07 23298.99 23182.50 23066.58 22951.25 22836.49 22722.31 22608.70 22495.66 22383.18 22271.26 22159.91 37 electricity cost savings $4,020.84 $4, 120.76 $4,223.16 $4,328.10 $4,435.66 $4,545.88 $4,658.85 $4,774.62 $4,893.27 $5,014.87 $5,139.49 $5,267.20 $5,398.09 $5,532.24 38 39 40 maintainance cost per kW $15 $15.30 $15.61 $15.92 $16.24 $16.56 $16.89 $17.23 $17.57 $17.93 $18.28 $18.65 $19.02 $19.40 41 total maint cost (based on 15kW) 42 43 insurance cost 0.30% 0.31% 0.31% 0.32% 0.32% 0.33% 0.34% 0.34 0.35% 0.36% 0.37% 0.37% 0.38% 0.39% 44 total insurance $ 45 15 $0.26 22049.11 $5,669.71 16 17 $0.26 $0.27 21938.86 21829.17 $5,810.61 $5,955.00 18 19 $0.28 $0.29 21720.02 21611.42 $6,102.98 $6,254.64 20 $0.30 $ 21503.36 $6,410.07 21 $0.31 21395.85 $6,569.36 22 23 $0.32 $0.33 21288.87 21182.42 $6,732.61 $6,899.91 24 25 26 $0.34 $0.35 $0.36 21076.51 20971.13 20866.27 $7,071.37 $7,247.10 $7,427.19 207 $7,6 $19.79 $20.19 $20.59 $21.00 $21.42 $21.85 $22.29 $22.73 $23.19 $23.65 $24.13 $24.61 $ 0.40% 0.40% 0.41% 0.42% 0.43% 0.44% 0.45%. 0.45% 0.46% 0.47% 0.48% 0.49% P Q R S T U Y W Y Z AA A A B D E F G . J K L M N o 1 Exhibit TN2 2 WELLS FARGO: SOLAR ENERGY FOR LOS ANGELES BRANCHES (A) AND (B) 3 Pro Forma Economic Model 4 5 In the cells below the "Assumptions for Case" are formulas for key variables in column B starting with B35 and rows 71 - 74. Do not modify these cells. 6 You are to enter the formulas only in the cells that are shaded: 7 7 8 Assumptions for Case: 9 9 Size, kW 15 kW 10 cost per kW $7,000 $ per kW Total cost $ 105,000.00 11 Efficienoy rating 18% % end-of-life salva 15% 12 annual degradation 0.50% % value to depreci $ 89,250,00 13 14 SIP rate $1.95 per W 15 system rating 12585 W Notes: 16 design factor 0.9 1) Electricity generation for year 1 is in cell B36 based on a formula in that cell. 17 For each succeeding year electricity generation declines by 0.5%, as stated in the case. 18 tax rate 38% of profits 2) The hurdle rate or discount rate is in cell B30 and is based on an after-tax rate, since all of the 19 tax credit 30% of system oost cash flows are adjusted for taxes. 20 3) The formula for the Solar Incentive Program (SIP) is in cell B64. 21 Electricity cost $0.17 per kWh 4) Total cash flow for the payback method is the formula in cell B71. 22 annual increase 37 5) Number of years for payback is in cell B74. 23 6) Initially assume straight line depreciation over 5 years; in question 3) you will use accelerated depreciation based on MACRS. 24 maintainance $15 per kW 25 annual increase 274 26 27 insurance 0.30% of total cost 28 annual increase 27. 29 30 discount rate 3.53% 31 32 33 year 34 1, 2 3 4 5 6 7 8 9 10 11 12 13 14 35 electricity cost $0.17 $0.18 $0.18 $0.19 $0.19 $0.20 $0.20 $0.21 $0.22 $0.22 $0.23 $0.24 $0.24 $0.25 36 electricity generation kW 23652 23533.74 23416.07 23298.99 23182.50 23066.58 22951.25 22836.49 22722.31 22608.70 22495.66 22383.18 22271.26 22159.91 37 electricity cost savings $4,020.84 $4, 120.76 $4,223.16 $4,328.10 $4,435.66 $4,545.88 $4,658.85 $4,774.62 $4,893.27 $5,014.87 $5,139.49 $5,267.20 $5,398.09 $5,532.24 38 39 40 maintainance cost per kW $15 $15.30 $15.61 $15.92 $16.24 $16.56 $16.89 $17.23 $17.57 $17.93 $18.28 $18.65 $19.02 $19.40 41 total maint cost (based on 15kW) 42 43 insurance cost 0.30% 0.31% 0.31% 0.32% 0.32% 0.33% 0.34% 0.34 0.35% 0.36% 0.37% 0.37% 0.38% 0.39% 44 total insurance $ 45 15 $0.26 22049.11 $5,669.71 16 17 $0.26 $0.27 21938.86 21829.17 $5,810.61 $5,955.00 18 19 $0.28 $0.29 21720.02 21611.42 $6,102.98 $6,254.64 20 $0.30 $ 21503.36 $6,410.07 21 $0.31 21395.85 $6,569.36 22 23 $0.32 $0.33 21288.87 21182.42 $6,732.61 $6,899.91 24 25 26 $0.34 $0.35 $0.36 21076.51 20971.13 20866.27 $7,071.37 $7,247.10 $7,427.19 207 $7,6 $19.79 $20.19 $20.59 $21.00 $21.42 $21.85 $22.29 $22.73 $23.19 $23.65 $24.13 $24.61 $ 0.40% 0.40% 0.41% 0.42% 0.43% 0.44% 0.45%. 0.45% 0.46% 0.47% 0.48% 0.49%

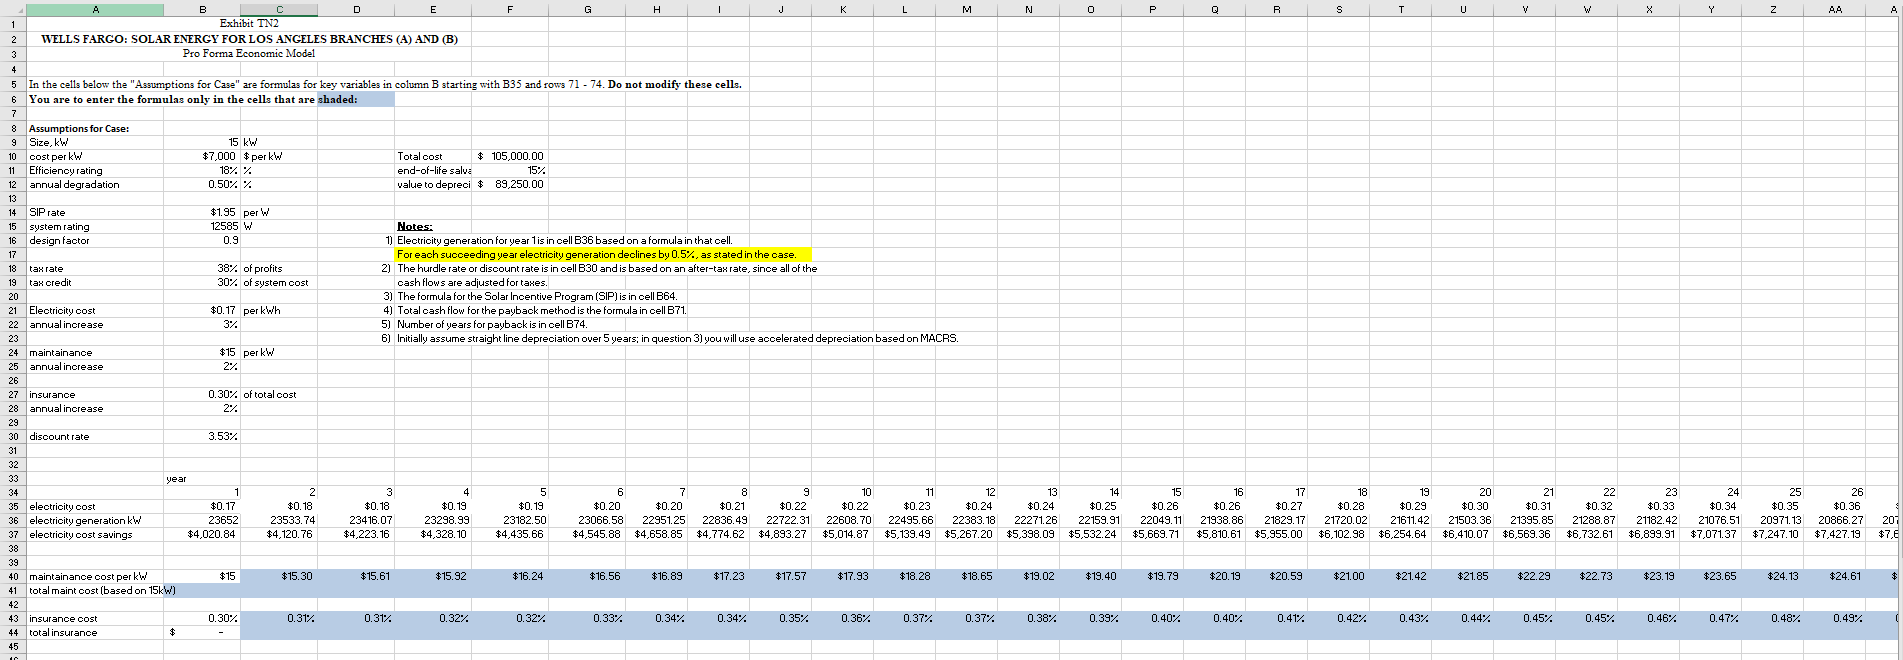
Step by Step Solution

There are 3 Steps involved in it

Step: 1

blur-text-image

Get Instant Access to Expert-Tailored Solutions

See step-by-step solutions with expert insights and AI powered tools for academic success

Step: 2

blur-text-image

Step: 3

blur-text-image

Ace Your Homework with AI

Get the answers you need in no time with our AI-driven, step-by-step assistance

Get Started

Recommended Textbook for

Dividend Policy On Share Price Volatility In Indian Stock Market

Authors: Vijay Deswal

1st Edition

3841859623, 978-3841859624

More Books