Answered step by step
Verified Expert Solution
Question
1 Approved Answer
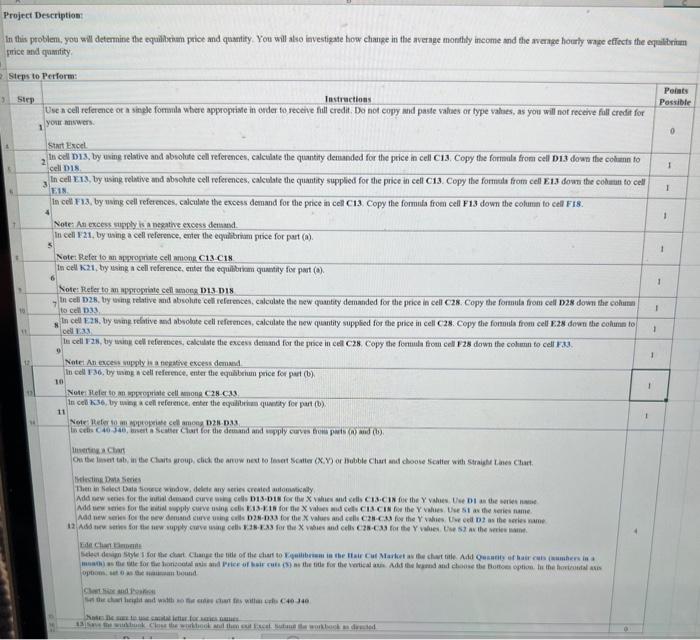
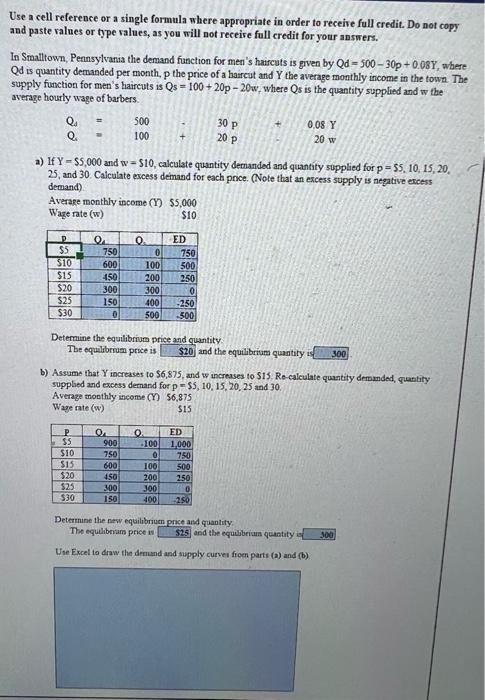
Please help me Input the Instructions into Microsoft Excel!! The problem is solved for you Project Description In this problem, you will determine the equilibrium
Please help me Input the Instructions into Microsoft Excel!! The problem is solved for you 

Project Description In this problem, you will determine the equilibrium price and quantity. You will also investigate how change in the average monthly income and the average hourly wage effects the equilibriu price and quity Steps to Perform Sirp Points Possible Instructions Use a cell reference of a single for where appropriate in order to receive hill credit. Do not copy and paste values or type values, as you will not receive full credit for YOU INWES 1 0 Start Excel In cell 013, by using relative and absolute cell references, calculate the quantity demanded for the price in cell C13 Copy the formals from cell 013 down the column to 2 1 cell DIS In cell E13, by using relative and absolute cell references, calculate the quantity supplied for the price in cell C13. Copy the formula from cell E13 down the court to cell 1 EIN in cell 13. by using cell references, calculate the excess demand for the price in cell C13 Copy the formula from cell F13 down the column to cell F18. 1 Note: An excess supply is a negative excess denied In cell F21, by using a cell reference, enter the equilibritom price for put() 1 Note: Refetto propriate cell monk C13 CIN In cell 21, by using a cell reference enter the equilibrim quantity for part (a) 1 Note: Refer to appropriate cell moon D13 DIS In cel 28. by using relative and absolute cell references, calculate the new quantity demanded for the price in cell 28. Copy the formula from cell D28 down the com to cell 033 1 In cel E, by wing relative and absolute cell references, calculate the new quantity supplied for the price in cell C copy the formula from cell E28 down the column to ol 1 Da cell F2, by winy cell references, calculate the excess denied for the price in cell C28. Copy the formula from cell F28 down the column to cell FX3 1 Note: An excess supply is a negative excess demand In cell 36. by mmg *oell referme enter the bem price for purt (b) 10 1 Note Refer to propriate cell Mong C2 CM In cel K36, by Wing cell reference enter the album wity for part (0) 11 Note Refer to clomon DENDA Inces 46.340, SC Chart for the demand and apply curves bom pisand (b) 11 0 Chant on the list tab, in the Charts group, click the arrow next to let Sote (X.) or Bubble Chust and choose Solter with Style Linen Chat Sleting Dwi Series Then in Select Date Show window, de ny series created atomically Add wees for the initial and curve celo D1-DIN for tw Xheta ICIN for the Yves Le Dias the Modernes for the wipply curve in le 13.1 for the del CISCINE the Yves Use Stax the series me A news for the dead cure using cu 2-33 for the X values and cell-ce for the Yes we well as the series name 12 Add news for the supply call for the X wies and calls for the Yves et the view Edel Scheldewyle for the chart Change the title of the datto allem in the Tai Chi Market the chile Add Que hacen when in a moss the wine for the boneca and Price of hair cut the title for the vertical. Add the end and choose the bottom options the basis options 10 und Cando egin with a switch C4040 ho Use a cell reference or a single formula where appropriate in order to receive full credit. Do not copy and paste values or type values, as you will not receive full credit for your answers. In Smalltown, Pennsylvania the demand function for men's haircuts is given by Qd = 500 - 30p +0.08Y, where Qd is quantity demanded per month, p the price of a haircut and Y the average monthly income in the town. The supply function for men's haircuts is Qs = 100 + 20p - 20w, where Qs is the quantity supplied and w the average hourly wage of barbers Q. 0.08 Y Q. 100 500 30 p 20 P 20 w a) 14Y - 55,000 and w=510, calculate quantity demanded and quantity supplied for p = 55, 10, 15, 20. 25, and 30. Calculate excess demand for each price. (Note that an excess supply is negative excess demand) Average monthly income (Y) $5,000 Wage rate (w) $10 $5 $10 $15 $20 $25 $30 750 600 450 300 150 0 O. 0 100 200 300 400 500 ED 750 500 250 0 -250 500 Determine the equilibrium price and quantity The equilibrium price is $20 and the equilibrium quantity is 300 b) Assume that Y increases to $6,875, and wincreases to 515 Recalculate quantity demanded, quantity supplied and excess demand for p -55, 10, 15, 20, 25 and 30 Average monthly income (Y) 56,875 Wage rate (w) $15 .. P $5 $10 S13 $20 $25 $30 O 900 750 600 450 300 150 0 -100 0 100 200 300 400 ED 1,000 750 500 250 0 250 Determine the new equilibrium price and quantity The equilibrum price $25 and the equilibrium quantity Use Excel to draw the demand and supply curves from parts () and (b) 300 Project Description In this problem, you will determine the equilibrium price and quantity. You will also investigate how change in the average monthly income and the average hourly wage effects the equilibriu price and quity Steps to Perform Sirp Points Possible Instructions Use a cell reference of a single for where appropriate in order to receive hill credit. Do not copy and paste values or type values, as you will not receive full credit for YOU INWES 1 0 Start Excel In cell 013, by using relative and absolute cell references, calculate the quantity demanded for the price in cell C13 Copy the formals from cell 013 down the column to 2 1 cell DIS In cell E13, by using relative and absolute cell references, calculate the quantity supplied for the price in cell C13. Copy the formula from cell E13 down the court to cell 1 EIN in cell 13. by using cell references, calculate the excess demand for the price in cell C13 Copy the formula from cell F13 down the column to cell F18. 1 Note: An excess supply is a negative excess denied In cell F21, by using a cell reference, enter the equilibritom price for put() 1 Note: Refetto propriate cell monk C13 CIN In cell 21, by using a cell reference enter the equilibrim quantity for part (a) 1 Note: Refer to appropriate cell moon D13 DIS In cel 28. by using relative and absolute cell references, calculate the new quantity demanded for the price in cell 28. Copy the formula from cell D28 down the com to cell 033 1 In cel E, by wing relative and absolute cell references, calculate the new quantity supplied for the price in cell C copy the formula from cell E28 down the column to ol 1 Da cell F2, by winy cell references, calculate the excess denied for the price in cell C28. Copy the formula from cell F28 down the column to cell FX3 1 Note: An excess supply is a negative excess demand In cell 36. by mmg *oell referme enter the bem price for purt (b) 10 1 Note Refer to propriate cell Mong C2 CM In cel K36, by Wing cell reference enter the album wity for part (0) 11 Note Refer to clomon DENDA Inces 46.340, SC Chart for the demand and apply curves bom pisand (b) 11 0 Chant on the list tab, in the Charts group, click the arrow next to let Sote (X.) or Bubble Chust and choose Solter with Style Linen Chat Sleting Dwi Series Then in Select Date Show window, de ny series created atomically Add wees for the initial and curve celo D1-DIN for tw Xheta ICIN for the Yves Le Dias the Modernes for the wipply curve in le 13.1 for the del CISCINE the Yves Use Stax the series me A news for the dead cure using cu 2-33 for the X values and cell-ce for the Yes we well as the series name 12 Add news for the supply call for the X wies and calls for the Yves et the view Edel Scheldewyle for the chart Change the title of the datto allem in the Tai Chi Market the chile Add Que hacen when in a moss the wine for the boneca and Price of hair cut the title for the vertical. Add the end and choose the bottom options the basis options 10 und Cando egin with a switch C4040 ho Use a cell reference or a single formula where appropriate in order to receive full credit. Do not copy and paste values or type values, as you will not receive full credit for your answers. In Smalltown, Pennsylvania the demand function for men's haircuts is given by Qd = 500 - 30p +0.08Y, where Qd is quantity demanded per month, p the price of a haircut and Y the average monthly income in the town. The supply function for men's haircuts is Qs = 100 + 20p - 20w, where Qs is the quantity supplied and w the average hourly wage of barbers Q. 0.08 Y Q. 100 500 30 p 20 P 20 w a) 14Y - 55,000 and w=510, calculate quantity demanded and quantity supplied for p = 55, 10, 15, 20. 25, and 30. Calculate excess demand for each price. (Note that an excess supply is negative excess demand) Average monthly income (Y) $5,000 Wage rate (w) $10 $5 $10 $15 $20 $25 $30 750 600 450 300 150 0 O. 0 100 200 300 400 500 ED 750 500 250 0 -250 500 Determine the equilibrium price and quantity The equilibrium price is $20 and the equilibrium quantity is 300 b) Assume that Y increases to $6,875, and wincreases to 515 Recalculate quantity demanded, quantity supplied and excess demand for p -55, 10, 15, 20, 25 and 30 Average monthly income (Y) 56,875 Wage rate (w) $15 .. P $5 $10 S13 $20 $25 $30 O 900 750 600 450 300 150 0 -100 0 100 200 300 400 ED 1,000 750 500 250 0 250 Determine the new equilibrium price and quantity The equilibrum price $25 and the equilibrium quantity Use Excel to draw the demand and supply curves from parts () and (b) 300 

Step by Step Solution
There are 3 Steps involved in it
Step: 1

Get Instant Access to Expert-Tailored Solutions
See step-by-step solutions with expert insights and AI powered tools for academic success
Step: 2

Step: 3

Ace Your Homework with AI
Get the answers you need in no time with our AI-driven, step-by-step assistance
Get Started


